Figure 3.
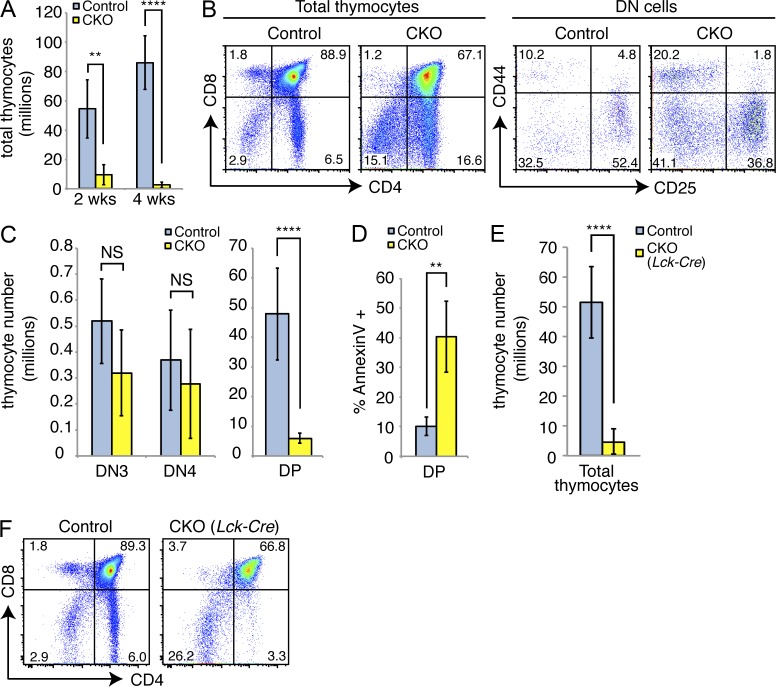
Loss of Dyrk1a adversely affects T cell development. (A) Mean thymocyte numbers in Control and CKO mice were assessed 2 and 4 wk after pI:pC treatment; n = 6 mice per genotype, pooled from 3 independent cohorts of 2 mice per genotype. (B) Representative flow cytometry analysis of total (left) and CD4−/CD8− double-negative (DN, right) thymocytes is shown. Numbers indicate the percentages in each gate; mean absolute numbers were quantified in (C); n = 6 mice per genotype, pooled from 3 independent cohorts of 2 mice per genotype. (D) Mean percentage of Annexin V+ cells was assessed from CD4+CD8+ double-positive (DP) thymocytes 2 wk after pI:pC treatment; n = 4 mice per genotype. Data are representative of 2 independent cohorts of n = 4 mice per genotype. (E) Mean total thymocyte numbers and representative flow cytometry analysis (F) of thymi from Dyrk1awt/wt Lck-Cre+ (Control) and Dyrk1af/f Lck-Cre+ (CKO) mice are shown; n = 6 mice per genotype, pooled from 3 independent cohorts of 2 mice per genotype. **, P < 0.01; ****, P < 0.0001.

