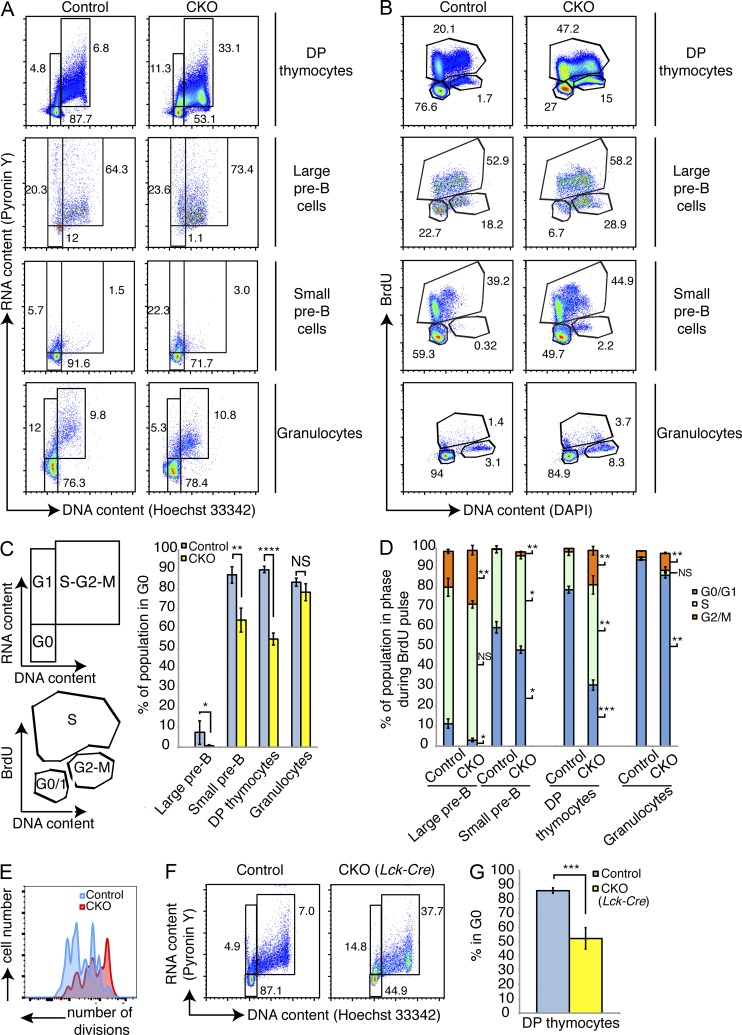
Figure 5.
Loss of Dyrk1a results in failed cell cycle exit during lymphoid development. Cell cycle status of bone marrow and thymocytes from Dyrk1af/f Mx1-Cre− (Control) and Dyrk1af/f Mx1-Cre+ (CKO) was assessed 4 wk after pI:pC treatment. (A and B) Representative flow cytometry plots depicting steady-state cell cycle status using DNA versus RNA content (A) and in vivo BrdU incorporation 24 h after BrdU injection (B) are shown. Numbers depict percentages in each gate. (C) The corresponding defined cell cycle phases and mean percentages in G0 are shown from the indicated Control and CKO cell types shown in A; n = 6 mice per genotype, pooled from 2 independent cohorts of 3 mice per genotype. (D) The mean percentages of cells in each phase of the cell cycle from the indicated Control and CKO cell types in B are shown; n = 4 mice per genotype. Data are representative of 2 independent experiments. Significant differences are denoted for each phase to the right of each CKO bar. (E) Flow cytometry was performed using CellTrace dye dilution in cultured FACS-purified Control and CKO large pre–B cells. Data are representative of two independent experiments. (F) Thymocytes from Control and CKO mice (Lck-Cre) were stained for DNA and RNA content to assess cell cycle status as in A. Representative flow cytometry plots for DP thymocytes from Control and CKO mice are shown; n = 4 mice per genotype, pooled from 2 independent cohorts of 2 mice per genotype. (G) Mean percentages of DP thymocytes in G0 are depicted; n = 4 mice per genotype, pooled from 2 independent cohorts of 2 mice per genotype. For all graphs, error bars depict SD. *, P < 0.05; **, P < 0.01; ***, P < 0.001; ****, P < 0.0001; NS, not significant.

