Figure 7.
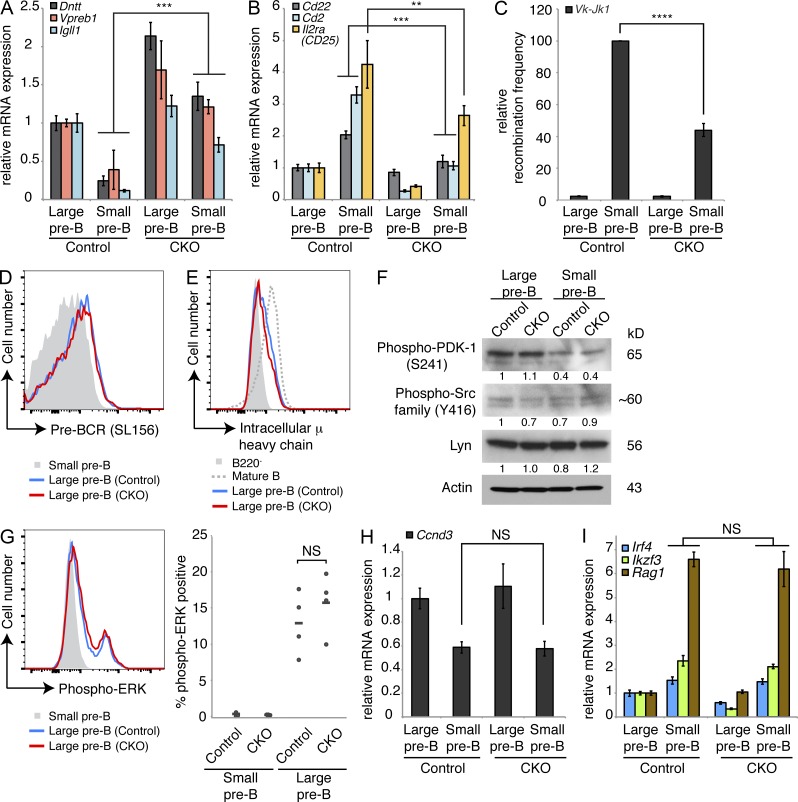
Loss of Dyrk1a alters pre–B cell differentiation markers without affecting pre–BCR signaling. (A and B) mRNA expression was analyzed by qRT-PCR to assess transcripts dynamically regulated during pre–B differentiation in FACS-purified large and small pre–B cells from the bone marrow of Dyrk1af/f Mx1-Cre− (Control) and Dyrk1af/f Mx1-Cre+ (CKO) 4 wk after pI:pC treatment. PCRs were performed using cDNA from 2–3 independently sorted pairs of mice, with 1 mouse per genotype in each pair. Error bars depict SD of triplicate wells for representative samples. (C) Vκ-Jκ1 light chain gene rearrangement was assessed by qPCR using genomic DNA from the same purified cell populations as in A and B; graph depicts mean recombination frequency as a percentage of Control small pre–B from two independent cohorts of mice, with cells pooled from two mice per genotype in each cohort; error bars depict SD. (D and E) Representative flow cytometry plots depicting surface pre–BCR (D) and intracellular μ heavy chain expression (E) in pre–B cells from the bone marrow of Control and CKO mice are shown. Data are representative of three independent cohorts of mice, each with two to three mice per genotype. (F) Western blots were performed to assess the levels of signaling proteins in FACS-purified large and small pre–B cells from the bone marrow of Control and CKO mice as indicated. Data are representative of two independently sorted samples, each pooled from three mice per genotype. Densitometry values were normalized to Actin. (G) ERK activation was assessed by intracellular staining for phospho-ERK in large and small pre–B cells from the bone marrow of Control and CKO mice as indicated in the flow cytometry plot (left); (right) individual (dots) and mean (bars) percentages of phospho-ERK+ cells in each population are shown; n = 4 mice per genotype. Data are representative of three independent experiments. (H and I) qRT-PCR analysis of Ccnd3 mRNA expression (H) and pre–BCR induced transcripts (I) from the same purified populations as in A and B were measured. All qRT-PCRs were performed using cDNA from two to three independently sorted pairs of mice, with one mouse per genotype in each pair. Error bars depict SD of triplicate wells for representative samples. **, P < 0.01; ***, P < 0.001; ****, P < 0.0001; NS, not significant.

