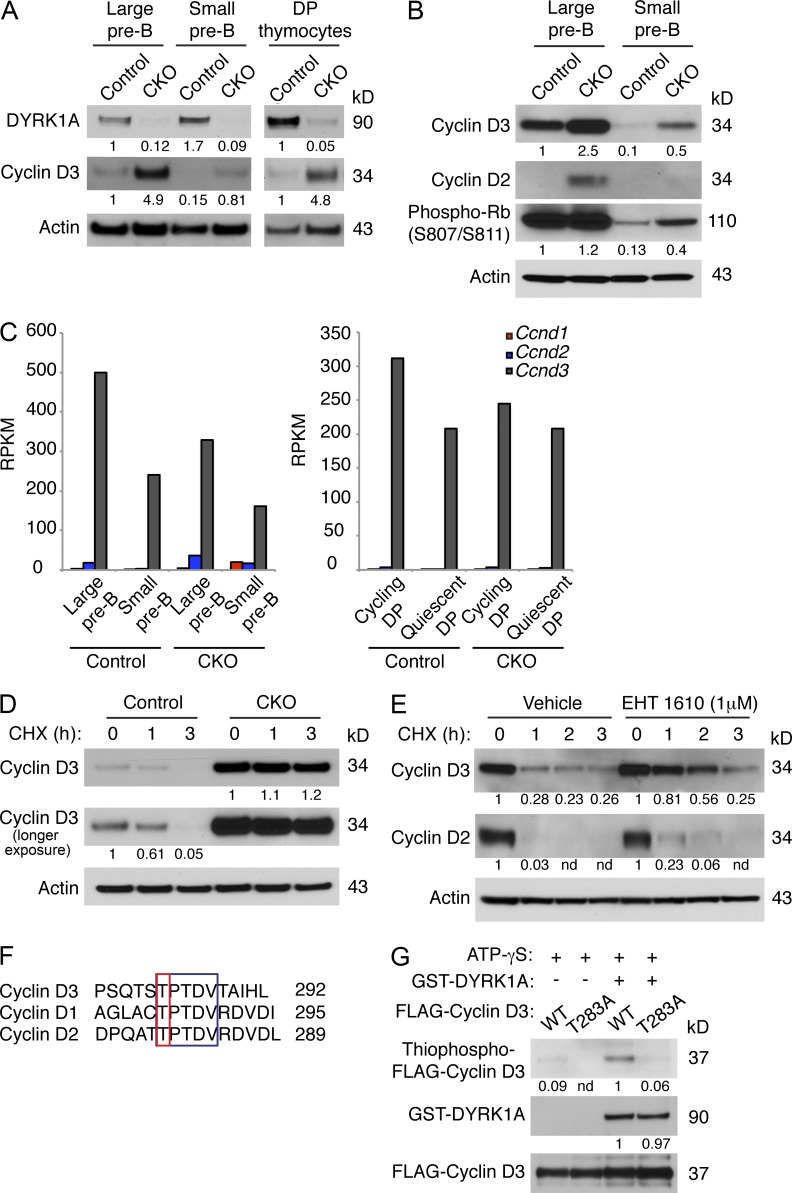
Figure 8.
DYRK1A destabilizes Cyclin D3 by phosphorylating T283. (A and B) Western blots of FACS-purified large and small pre–B cells from Dyrk1af/f Mx1-Cre− (Control) and Dyrk1af/f Mx1-Cre+ (CKO) mice 4 wk after pI:pC treatment were assessed for the indicated proteins as shown. The same membrane (cut into segments according to molecular weight) from Fig. 7 F was stripped and reprobed, hence the same loading control is shown here. Data are representative of three independent experiments. Densitometry values were normalized to actin. (C) The expression levels of the D-type Cyclin transcripts from RNA-seq data (from Fig. 6) are shown for Control and CKO mice. (D and E) Control and CKO thymocytes (D), or WT cultured pre–B cells ± EHT 1610 (E) were treated with cycloheximide (25 µg/ml) for the indicated times before Western blot analysis. Data are representative of three independent experiments. Densitometry values were normalized to actin. (F) An amino acid alignment of C-terminal phosphodegrons in the D-type Cyclins is shown. Conserved residues are highlighted in the blue box; phosphorylated threonines are highlighted in the red box. (G) FLAG-tagged Cyclin D3 (WT or T283A) was immunoprecipitated from transfected 293T cells and used for in vitro kinase assays with recombinant active DYRK1A and ATP-γS. The reaction products were alkylated with PNBM and analyzed for thiophosphate esters by Western blotting. Data are representative of three independent assays. Densitometry values were normalized to FLAG-Cyclin D3.

