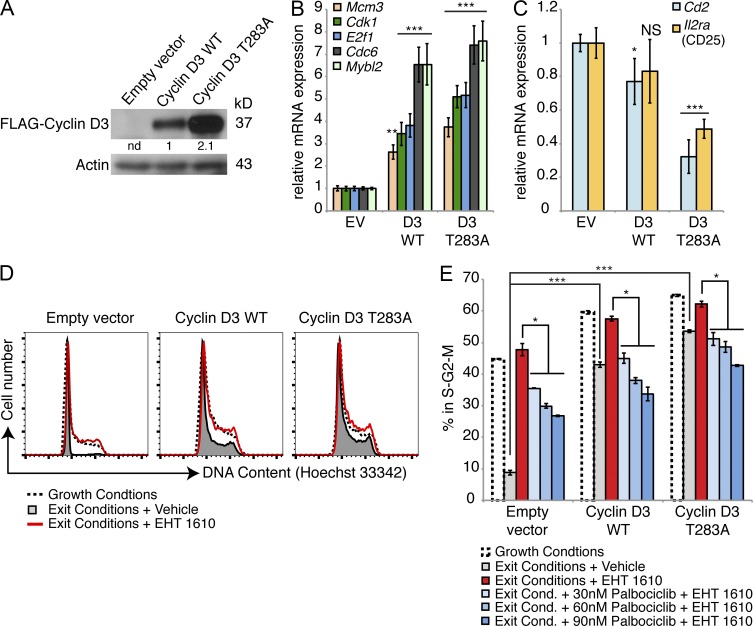
Figure 9.
Expression of Cyclin D3 T283A mimics loss of DYRK1A activity. (A) Protein expression levels of FLAG-tagged Cyclin D3 retroviral constructs in cultured WT pre–B cells 2 d after transduction were assessed. Densitometry values were normalized to Actin. (B and C) mRNA expression levels of E2F target genes (B) and differentiation markers (C) were assessed by qRT-PCR in FACS-purified WT small pre–B cells after transduction with the indicated constructs. RT-PCRs were performed from two independently sorted samples for each construct; error bars depict SD of triplicate wells for representative samples. *, P < 0.05; **, P < 0.01; ***, P < 0.001; NS, not significant (indicated condition vs. empty vector). (D) Cell cycle analysis was performed in cultured WT pre–B cells after 2 d of growth conditions (5 ng/ml IL-7 and 10 ng/ml SCF) (dotted line), cell cycle exit conditions (0.05 ng/ml IL-7 and 0.1 ng/ml SCF; shaded gray), or exit conditions in the presence of 500 nM EHT 1610 (red line). (E) Percentages of cells from (D) in S-G2-M under the indicated conditions are shown; error bars depict SD of duplicate wells from a representative of four independent experiments, two of which included Palbociclib treatment. *, P < 0.05; ***, P < 0.001.

