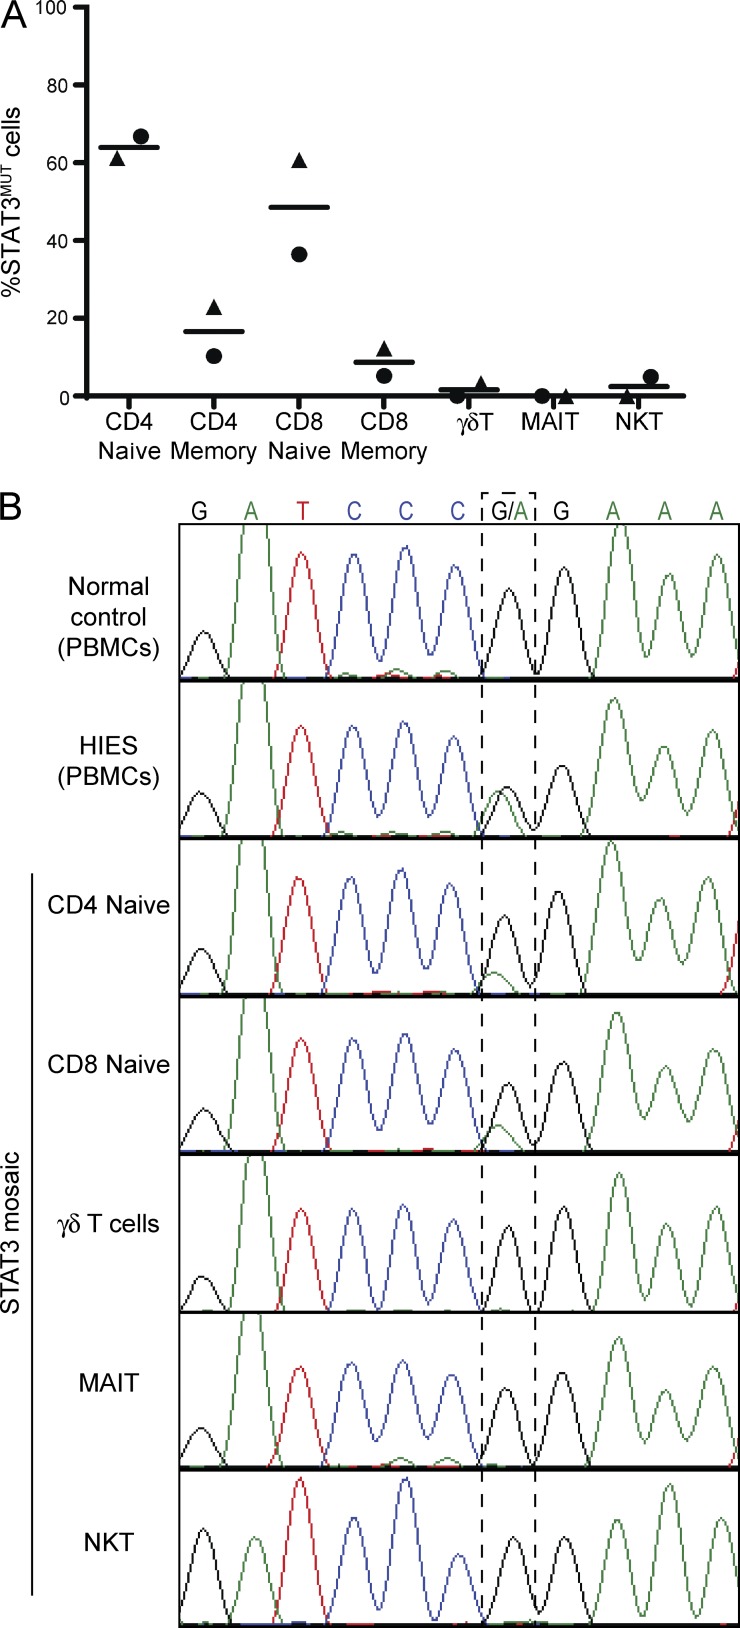
Figure 2.
Circulating unconventional T cells in individuals mosaic for STAT3 mutations all express the WT genotype. (A) qPCR was performed on DNA from sorted T cell populations from STAT3 mosaic individuals using probes specific for the WT or disease-causing genotype. Different symbols represent the two individuals examined. Horizontal bars indicate the mean. (B) Exons 12–14 of STAT3 were amplified from DNA from PBMCs from a normal donor (WBC) or a STAT3-deficient patient (AD-HIES), or the indicated populations of sorted cells from a mosaic individual with the 1145G>A STAT3 mutation. Chromatograms depict heterozygosity of the STAT3-deficient patient at this SNP and different degrees of mosaicism in distinct cell lineages in the mosaic individual.

