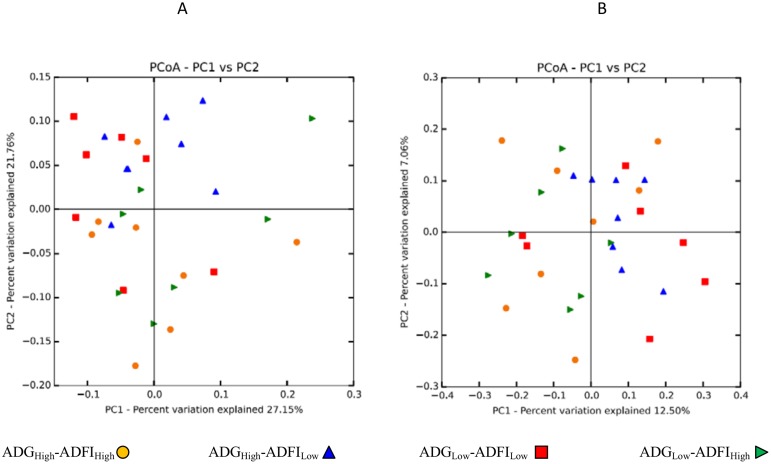
Fig 2. UniFrac principal coordinates analysis (PCoA) displaying correlations among the bacterial communities of the 4 groups.
A) Weighted PCoA analyzed from rarefied subsets of 25,000 sequences from each sample. B) Unweighted PCoA analyzed from rarefied subsets of 25,000 sequences from each sample. n = 8, represented by differing symbols.

