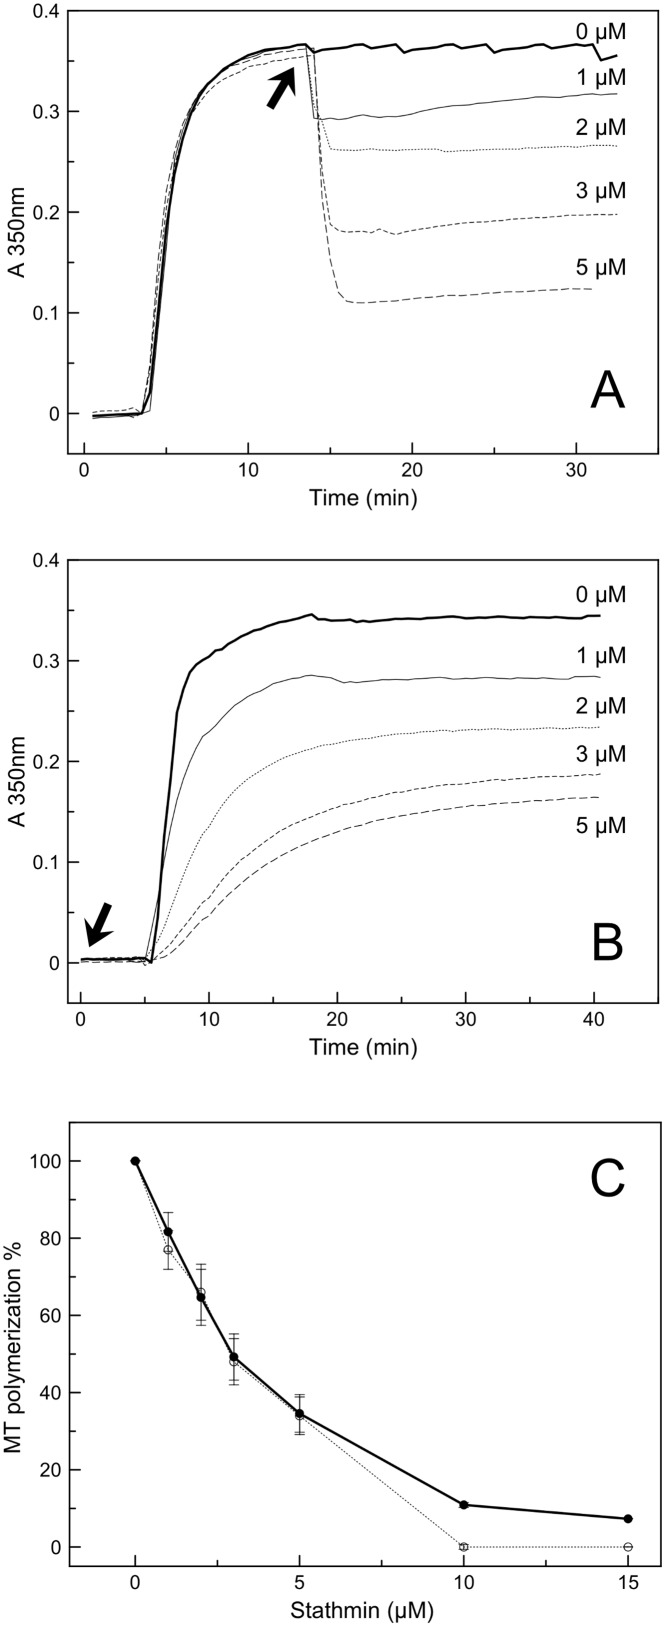
Fig 2. Effect of stathmin on in vitro microtubules polymerization in PM buffer followed by turbidity.
Various concentrations of stathmin ranging from 0 to 15μM were added at the arrow to 10μM tubulin after (panel A) or before (panel B) addition of 10μM paclitaxel. Panel A and B are representative turbidimetric curves of samples treated with 0, 1, 2, 3, or 5μM stathmin. Panel C represents the average of at least three experiment for each stathmin concentration (0, 1, 2, 3, 5, 10 and 15μM). Solid line corresponds to addition of stathmin after paclitaxel (panel A conditions) and dotted line corresponds to addition of stathmin before paclitaxel (panel B conditions) showing that the effect of stathmin on polymerization is similar whether stathmin is added before or after paclitaxel.

