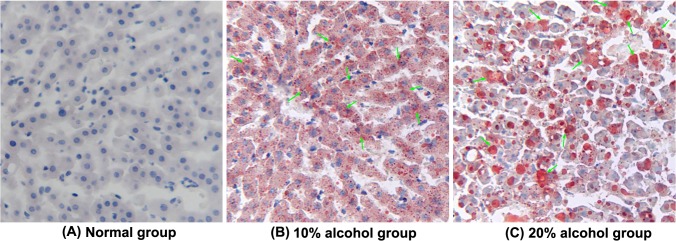
Fig 3. Representative histological feature of liver sections stained with oil red O staining (200×), depicting the effect of different treatments on the liver histopathology of tree shrews with AFLD.

(A) Normal control group. (B) 10% alcohol-induced fatty liver with fat vacuoles (indicated by arrowhead) around the hepatocytes was graded as moderate in the AFLD group. (C) 20% alcohol-induced fatty liver with fat vacuoles (indicated by arrowhead) around the hepatocytes was graded as high in the AFLD group.
