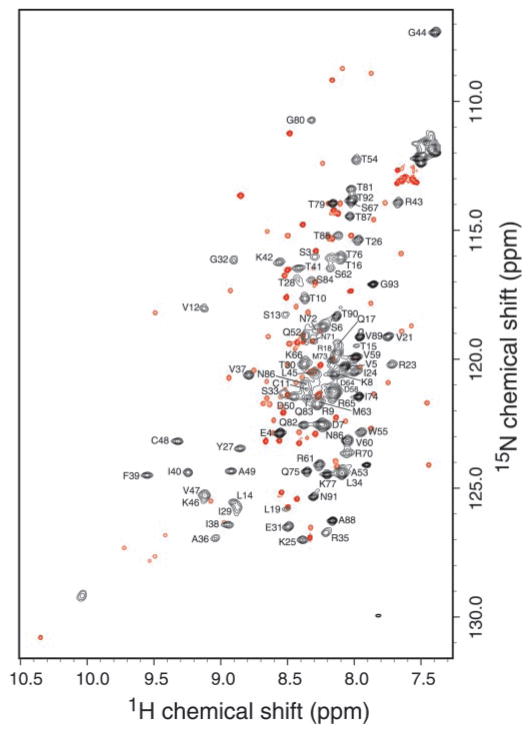
Fig. 1. Overlay of 15N-1H HSQC spectra of hLtn collected at 45°C with no NaCl (black) and at 10 °C with 200 mM NaCl (red).
Both samples contained 20 mM sodium phosphate, pH 6.0, and 0.05% sodium azide. Backbone NH assignments for the high temperature spectrum are indicated by the one-letter amino acid code and residue number.

