
Fig. 5. Tryptophan fluorescence as a function of salt concentration and temperature.
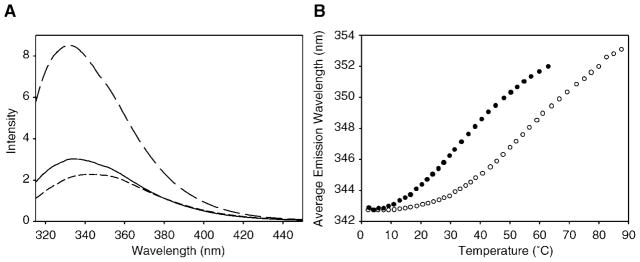
A, fluorescence emission spectra of hLtn at 10.6 (long dashes) and 53.9 °C (short dashes) in the absence of NaCl and at 53.9 °C in the presence of 200 mM NaCl (solid line). B, intrinsic fluorescence of Trp-55 of hLtn as a function of temperature at 0 and 200 mM NaCl. Average emission wavelengths are plotted for hLtn in 0 mM (solid circles) and 200 mM NaCl (open circles).