
Figure 1. Manhattan plot for genome-wide tests of association in meta-analysis.
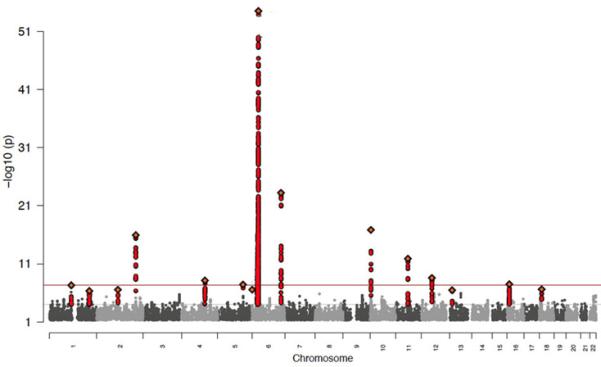
In order to conduct a meta-analysis across two GWAS, genotypes were imputed for each data set yielding 1.2 million SNPs. Standard association analysis with logistic regression including PC covariates was performed within each cohort and results were combined with standard-error weighted meta-analysis.