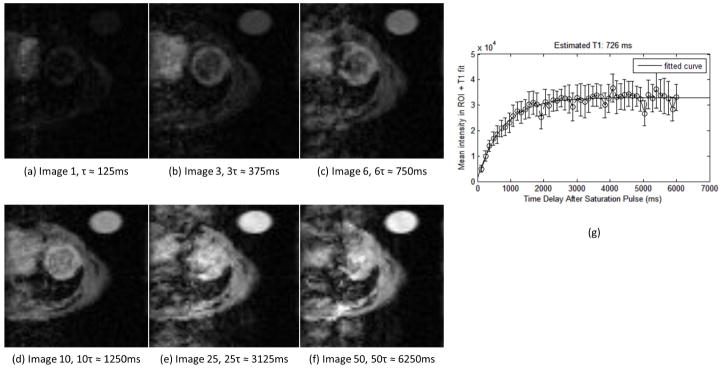
Figure 2.

Example of raw data from saturation recovery Look-Locker (SRLL) sequence. A series of 50 images (single mid-ventricular slice, short-axis view) was acquired after an initial saturation pulse. Time delay between sequential images was τ and was computed as the average R-R interval during the acquisition. The images shown here were acquired at (a) 1τ ≈ 125ms (b) 3τ ≈ 375ms (c) 6τ ≈ 750ms (d) 10τ ≈ 1250ms (e) 25τ ≈ 3125ms (f) 50τ ≈ 6250ms. Frame (g) shows an example T1* recovery curve fitted from these data from a region-of-interest (ROI) taken in the left-ventricular free wall. Error bars indicate the standard deviation of the intensity within the ROI.
