
Figure 1. T cells utilize MyD88 signaling to coordinate germinal center responses.
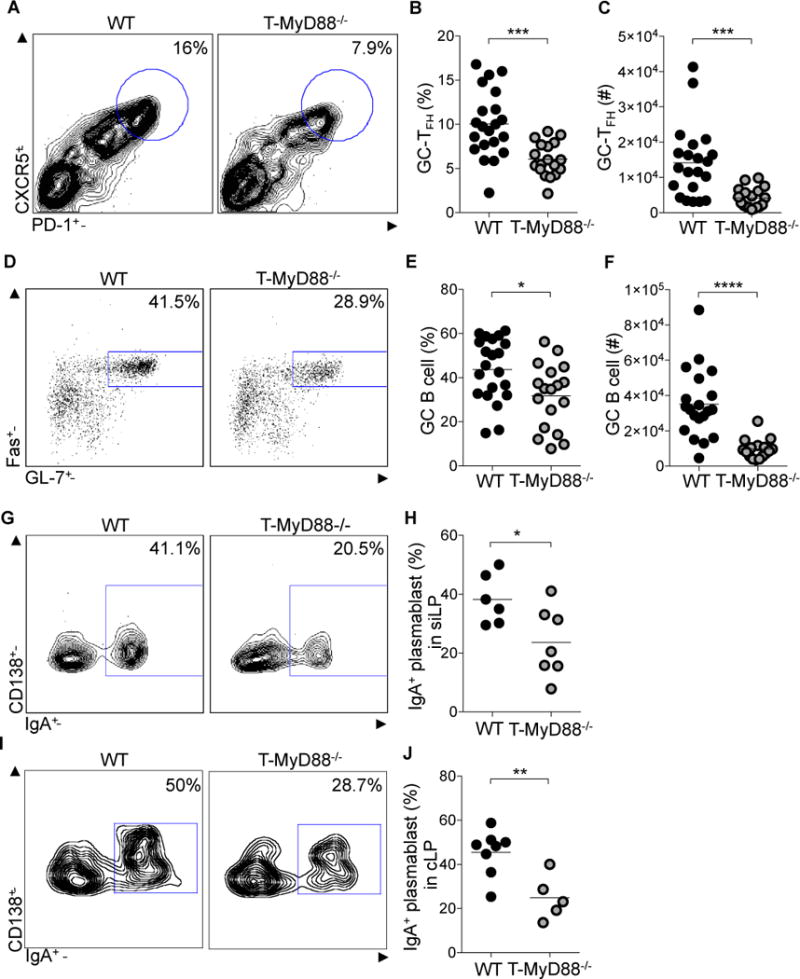
(A–C) GC-TFH cells from PPs, defined by CD3+CD4+B220−CXCR5hiPD-1hi, were measured by flow cytometry. (A) Representative plots were previously gated on CD3+CD4+B220− cells. (B) Frequency and (C) absolute numbers of GC-TFH cells (n= 21 WT, n=18 T-MyD88−/−).
(D–F) GC B cells, defined by B220+IgDlowFas+GL-7+, from PPs were measured by flow cytometry. (D) Representative plots were previously gated on B220+IgDlow cells. (E) Frequency and (F) absolute numbers of GC B cells (n=21 WT, n=18 T-MyD88−/−).
(G–J) IgA+ plasmablasts, defined as B220−CD138+IgA+, within the siLP and cLP were measured by flow cytometry (G), Representative plots were previously gated on CD138+ B220− cells from siLP. (H) Frequencies of IgA+ plasmablasts in siLP (n=6 WT, n=7 T-MyD88−/−). (I) Representative plots were previously gated on CD138+ B220− cells from cLP. (J) Frequencies of IgA+ plasmablasts in cLP (n=8 WT, n=5 T-MyD88−/−). Unpaired two-tailed Student’s t-tests were used for all comparisons. P-value<0.05 (*); P-value<0.01 (**); P-value<0.001 (***). Lines in scatterplots represent means. See also Figures S1–4.