
Figure 4.
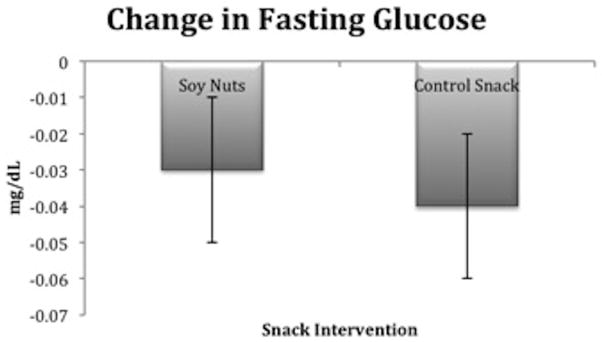
Relative change in glucose (mg/dL) was significantly different after soy nuts, compared to the control snack (P=0.02). The least squares means (LSM) ± SE after soy nuts was 107.7 ± 2.2 and after control snack, 105.8 ± 2.2.
Official websites use .gov
A
.gov website belongs to an official
government organization in the United States.
Secure .gov websites use HTTPS
A lock (
) or https:// means you've safely
connected to the .gov website. Share sensitive
information only on official, secure websites.
Relative change in glucose (mg/dL) was significantly different after soy nuts, compared to the control snack (P=0.02). The least squares means (LSM) ± SE after soy nuts was 107.7 ± 2.2 and after control snack, 105.8 ± 2.2.