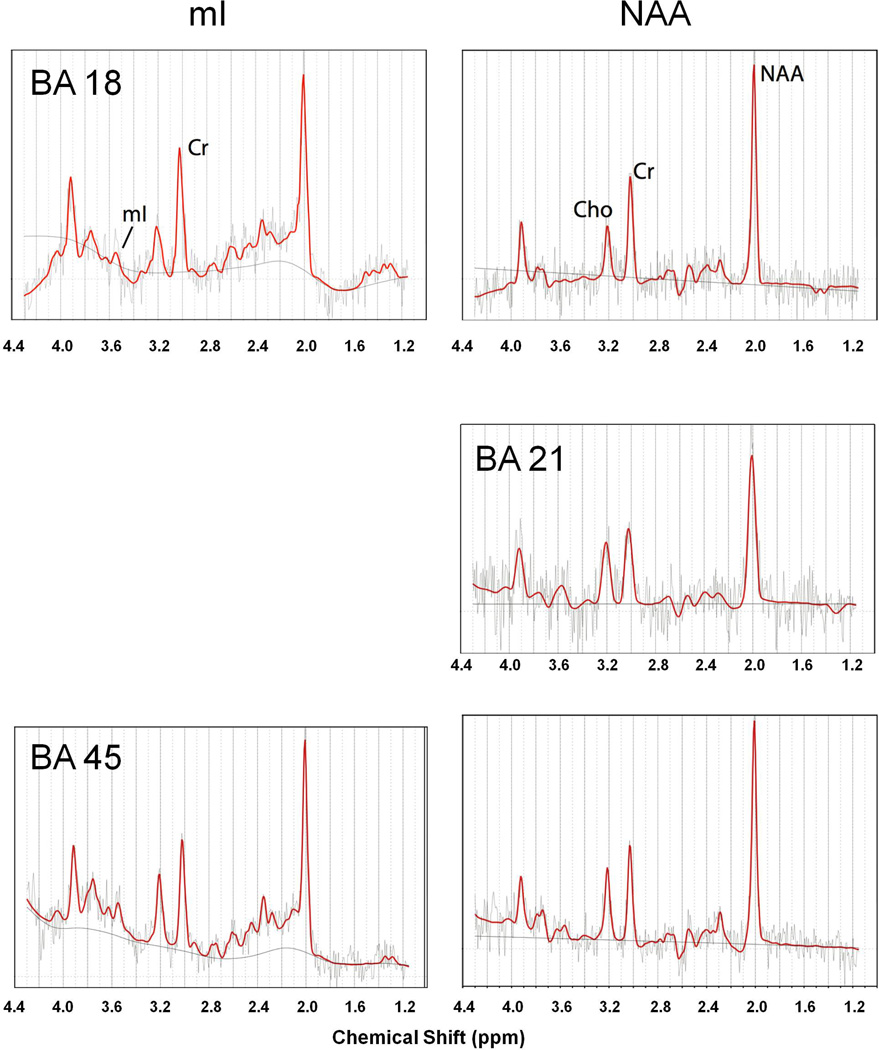
Figure 2. Representative fitted spectra.
Short (mI, left column) and long (NAA, right column) echo spectra from Brodmann areas (BA) 18 (top row), 21(middle row) and 45(bottom row) taken from a single subject. Spectra were fit using LCmodel (red lines). Horizontal axis indicates chemical shift in parts per million (ppm). Fitted baseline spline is indicated as solid line. Due to technical restrictions, no short echo (mI) spectra are provide for BA 21.

