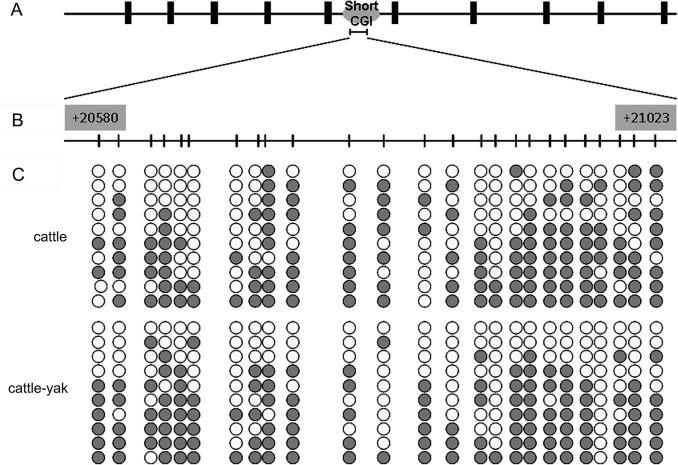
Fig 2. The methylation profile of the short CpG island in the bBoule gene body.
(A) Schematic diagram of the short CGI within the bBoule gene body. (B) Schematic depiction of the CpG sites for methylation analysis. Nucleotide numbering is relative to +1 at the initiating ATG codon. The short vertical bars represent the CpG dinucleotides. (C) Methylation statuses of bBoule in testes of cattle and cattle-yak hybrids. Each line represents an individual bacterial clone that was sequenced. Open circles indicate unmethylated CpG sites. Black circles indicate methylated CpG sites.

