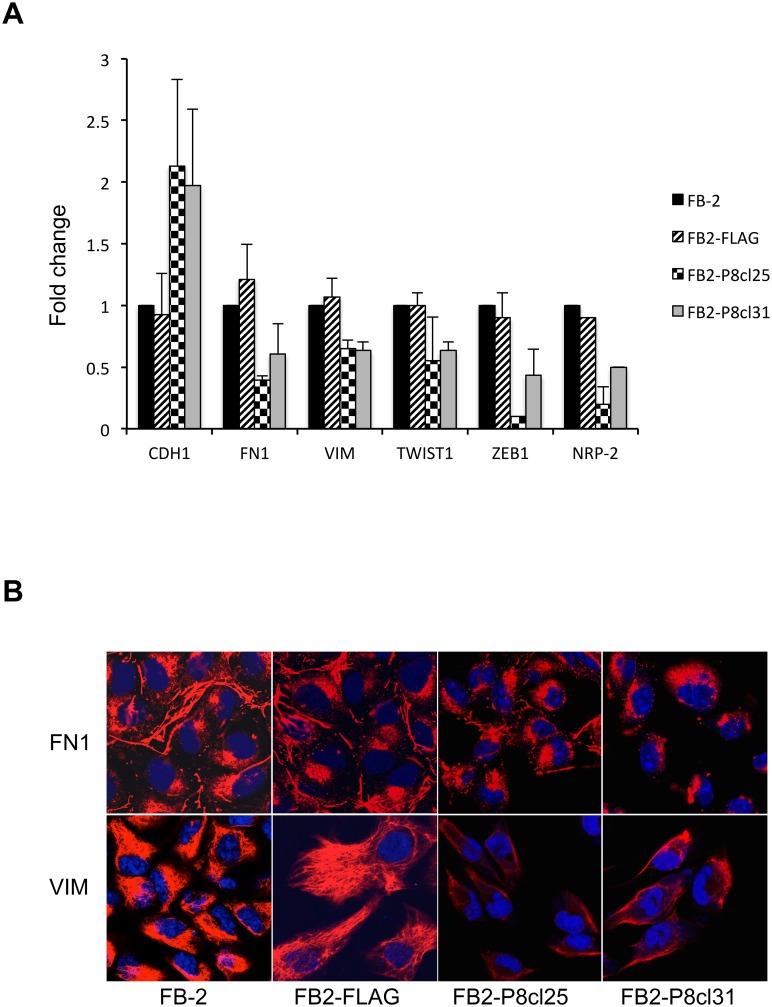
Fig 4. Effect of NRP2 downregulation on EMT in thyroid cancer cells.
(A) qRT-PCR analysis was performed on total RNA prepared from wild-type FB-2 cells and individual Pax8 stable clones. The expression of E-cadherin, fibronectin-1, vimentin, twist-1 and zeb-1 was measured. The values are means ± SD of three independent experiments in duplicate, normalized by the expression of ABL1 and expressed as fold change with respect to the expression in FB-2 control cells, whose value was set at 1.0. Statistical analysis uses t-test (p ≤ 0.05). (B) Indirect immunofluorenscence showing vimentin and fibronectin-1 staining in control cells and Pax8 stable clones.

