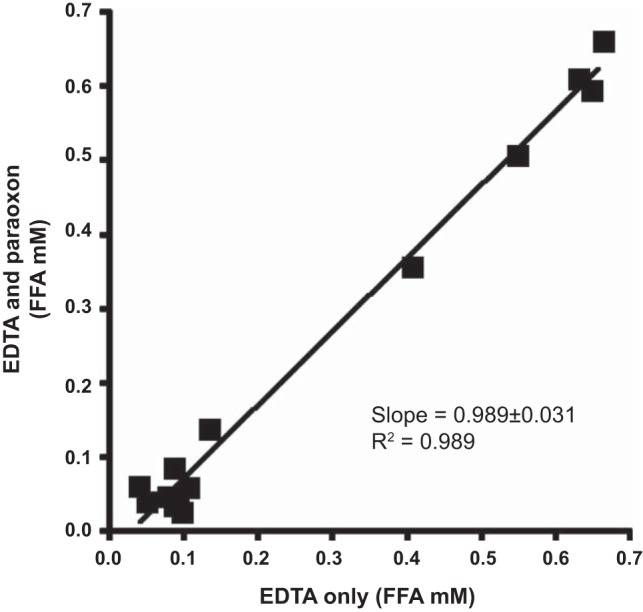
Fig. 1.

Comparison between free fatty acid (FFA) concentrations in samples treated with EDTA and EDTA plus paraoxon (both nonheparinized tubes). Not shown is the comparison between EDTA and paraoxon plus EDTA in heparinized tubes provided a slope of 0.0989 ± 0.031 and an r2 value of 0.989 when processed as described in materials and methods.
