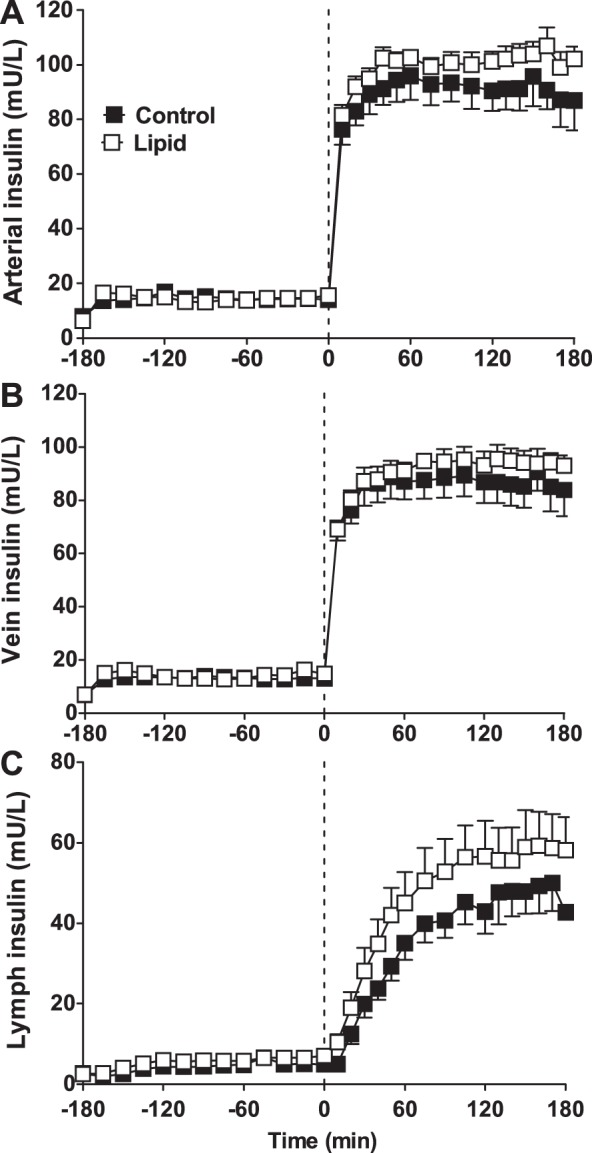
Fig. 4.

Insulin concentrations in artery (A), vein (B), and lymph (C) for control (saline; ■) and lipid-infused (□) animals. Lymph insulin is significantly lower than arterial insulin throughout. Vein insulin is slightly lower than arterial insulin. Vertical dotted line represents initiation of hyperinsulinemia at time 0. There were no significant differences between control and lipid at any time point.
