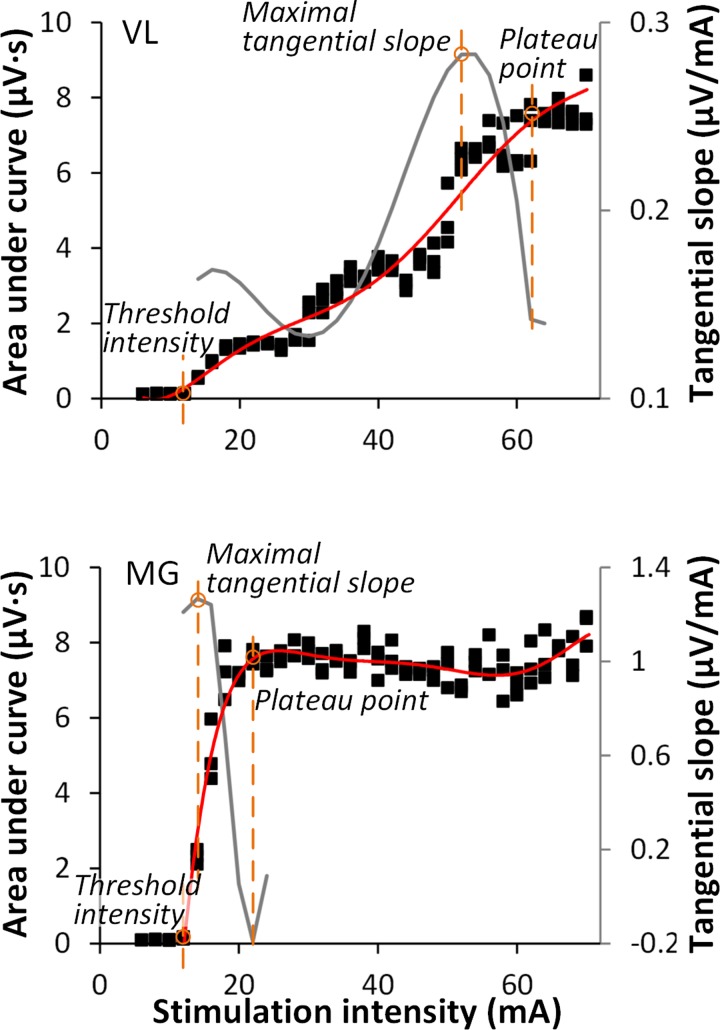
Fig. 2.
Examples of recruitment curves (solid squares, left Y-axis) of VL and MG recorded in one participant. A sixth-order polynomial function (red line) was fitted to each curve; tangential slope was then computed as the first derivative (gray line, right Y-axis). Specific parameters were taken from the recruitment curve for experimental comparison: threshold intensity, maximal tangential slope, and plateau point.

