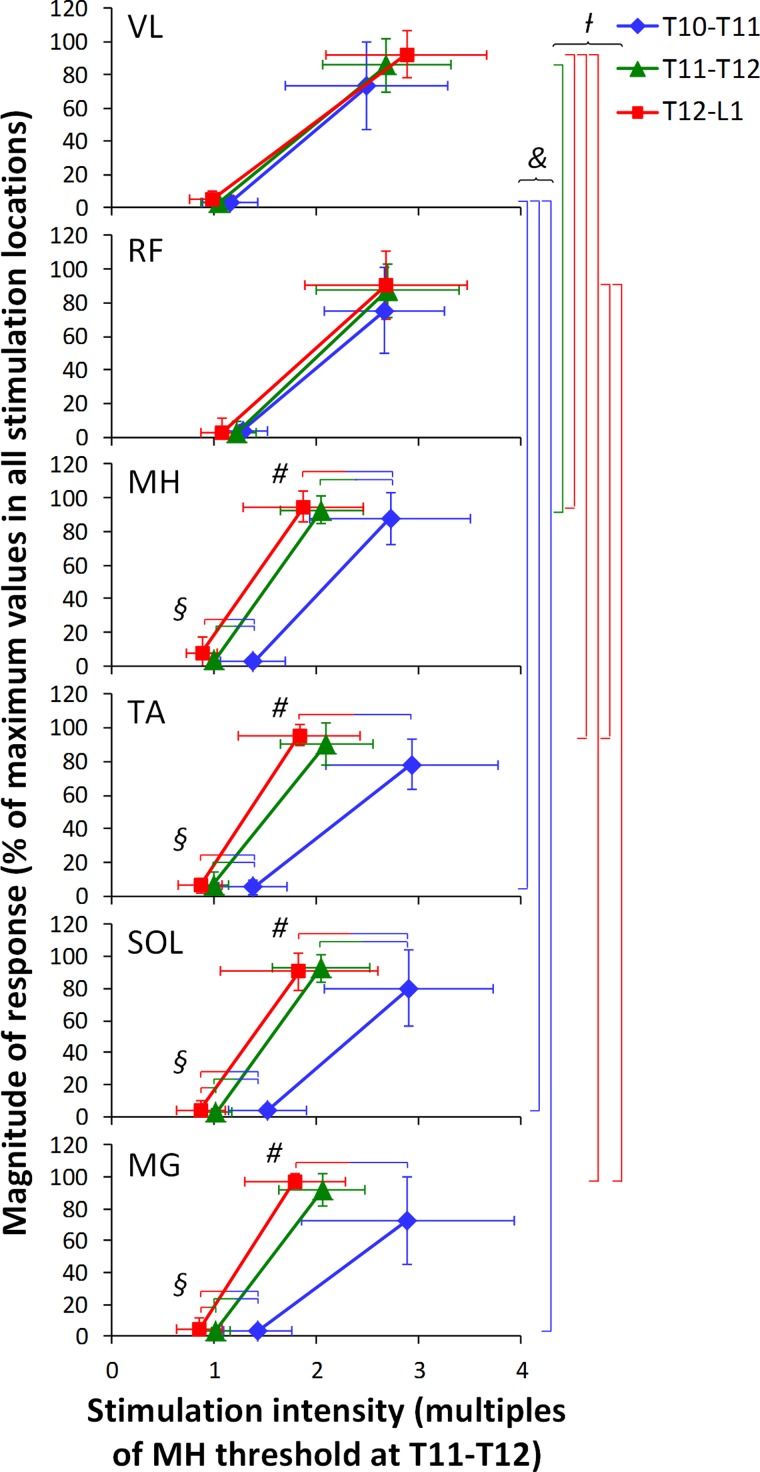
Fig. 5.
Pooled data of the thresholds and plateau points in right leg muscles at three stimulation locations. The magnitude of responses was normalized to the maximum area of each muscle across three stimulation locations. The stimulation intensity was normalized to the motor threshold of MH at T11–T12. Colored vertical bars on the right indicate statistically significant differences in the stimulation intensities required to produce threshold (&) or plateau point (/) responses between different muscles at each location (i.e., blue bars indicate the difference in VL vs. TA, SOL, and MG at T10–T11; green bar indicates the difference in VL vs. MH at T11–T12; and red bars indicate the difference in VL vs. MH, TA, and MG, as well as RF vs. TA and MG at T12–L1). Bicolored horizontal bars indicate significant differences in the stimulation intensities required to produce threshold (§) or plateau responses (#) in a single muscle between different stimulation locations (i.e., red-blue bars indicate the difference between T12–L1 and T10–T11; green-blue bars indicate the difference between T11–T12 and T10–T11; and red-green bars indicate the difference between T12–L1 and T11–T12) (P < 0.05).

