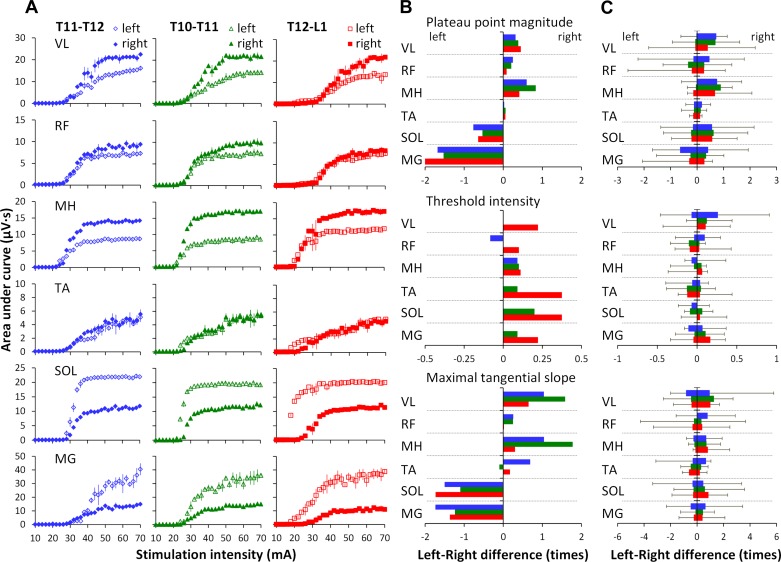
Fig. 7.
A: recruitment curves of left and right muscles at each location of spinal stimulation in one participant. Individual (B) and pooled data (C) illustrating the asymmetry level between left and right muscles in the plateau point magnitude (top), threshold intensity (middle), and maximal tangential slope (bottom).

