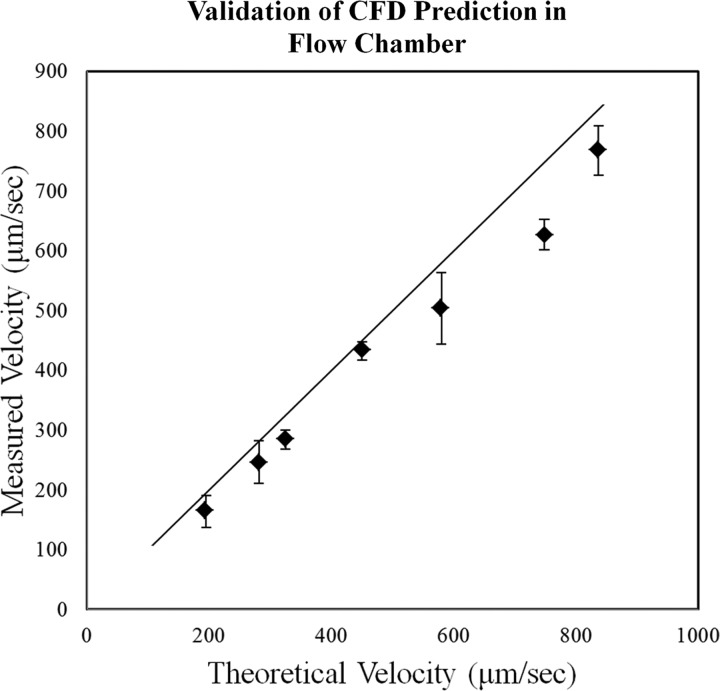
Fig. 3.
Device validation. Fluorescent beads of 5 μm were pumped through the chamber while tracking them using fluorescent microscopy. Data are plotted as the average ± SD. The black line is reference of 1:1 measured:theoretical, where the CFD-predicted velocities agree measured velocities. This exact relationship was not demonstrated, likely due to the fact that the measured microscope plane was a finite thickness. Therefore, beads traveling less than the maximal velocity were measured as well; hence, the measured velocities were slightly less than the predicted velocities.

