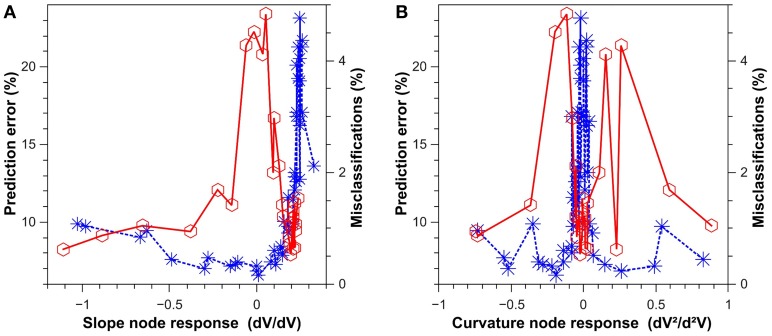
Figure 5.
Results for a classification task (blue asterisks) and a prediction task (red circles). (A) Performance of the system as a function of the slope of the node-response curve at the operating point. (B) Performance of the system as a function of the curvature of the node response at the operating point. The prediction task (SantaFe time series prediction) was evaluated via the normalized mean square error. The classification task (spoken digit recognition) was evaluated via the misclassification ratio. The results were obtained with the opto-electronic system introduced in Larger et al. (2012).

