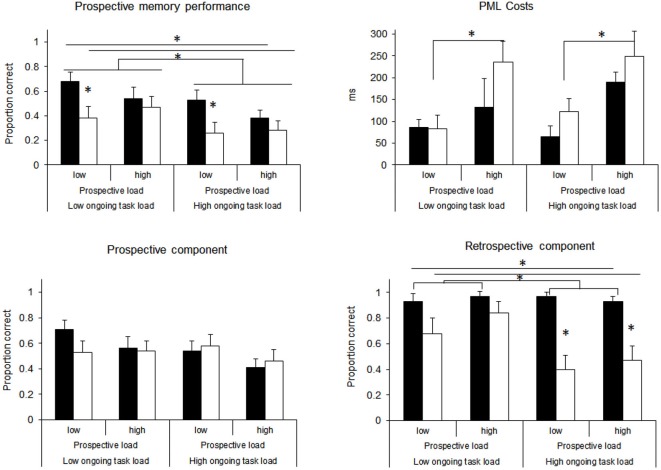
Figure 4.
Results of Experiment 2, separately for overall prospective memory performance, PML Costs in the ongoing task, the prospective component (releasing the shift-key), and the retrospective component (pressing the correct response). Black bars represent the low RL condition, white bars the high RL conditions. Significant differences (p < 0.05) are indicated by asterisks. Error bars represent standard errors.

