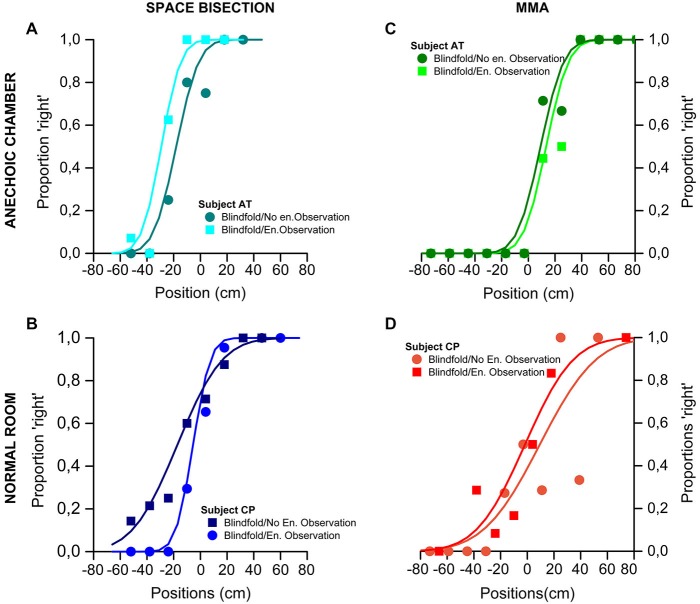
Figure 2.
Results of the Space Bisection Task and MAA of two participants, one for each group (normal room and anechoic chamber) as example. (A,B) Space bisection: proportion of trials judged “closer to the right sound source”, plotted against speaker position (in cm). The area of the dots is the proportion of trials at that position, normalized by the total number of trials performed by each participants. At the top-left the results obtained in the anechoic chamber by participant AT (A); at the bottom-left the results obtained in the normal room by participant CP (B). Both sets of data are it with the Gaussian error function. (C,D) MAA: proportion of trials where the second of a two-sound sequence was reported to the right of the first, plotted against difference in speaker position. At the top-right the results obtained in the anechoic chamber by participant AT (C); at the bottom-right the results obtained in the normal room by participant CP (D) Again the fits are the Gaussian error function.

