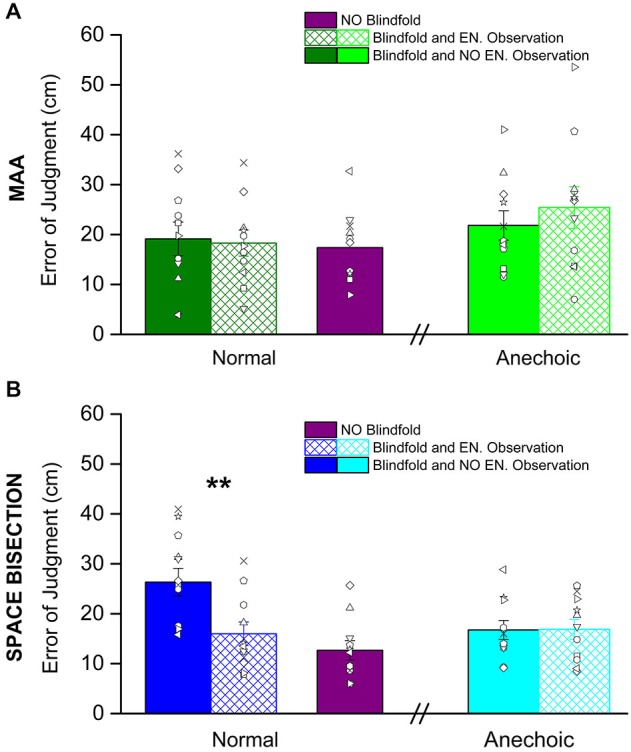
Figure 3.

Shown here are the average precision thresholds obtain in the MAA (A) and Space Bisection (B) tasks. (A) The dark green bars, on the left, represent the average precision thresholds obtained in the normal room before (fill in dark green bar) and after (reticulus dark green bar) environmental observation. On the right the light green bars are the average precision thresholds obtained in the anechoic chamber before (fill in light green bar) and after (reticulus light green bar) environmental observation. The violet bar is the average precision obtained by the subject in full vision in the normal room. The dots represent individual data. (B) For the space bisection, dark blue bars, on the left, represent the average precision thresholds obtained in the normal room before (fill in dark blue bar) and after (reticulus dark blue bar) environmental observation. On the right the light blue bars are the average precision thresholds obtained in the anechoic chamber before (fill in light blue bar) and after (reticulus light blue bar) environmental observation. Also in this case the violet bar represent the average precision obtained by the subject in full vision in the normal room. The dots represent individual data. (**) Indicates a significant difference of precision between before and after environmental observation in the normal room (p < 0.01).
