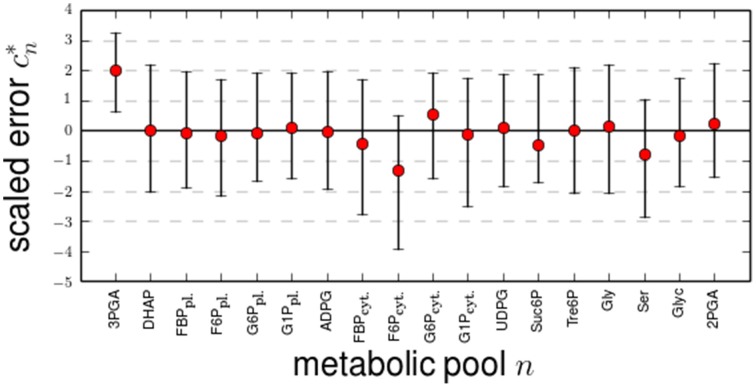
Figure 1.
Changes of optimized metabolic content in Scenario B. The differences (errors) between the optimized metabolic content csim, n (red circle) as well as their lower and upper 95%-confidence limits (error bars) to the measured values cobs, n were scaled by the measured standard deviation by . All changes of the values by the optimization can be explained by measurements errors. Note that for the assumed normal distribution of the measurement errors, the 95% confidence intervals corresponds to 2 σcobs., n.

