Figure 2.

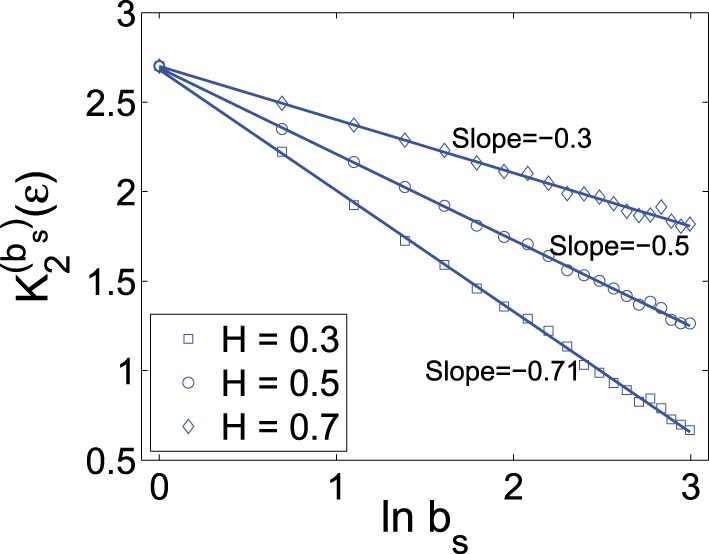
K(bs)2 (ε) vs. ln bs curves for fGn processes with different H values. The scale ε is chosen as 20% of the standard deviation of the corresponding fGn process. H value is estimated as 1 plus the slope of the curve.

K(bs)2 (ε) vs. ln bs curves for fGn processes with different H values. The scale ε is chosen as 20% of the standard deviation of the corresponding fGn process. H value is estimated as 1 plus the slope of the curve.