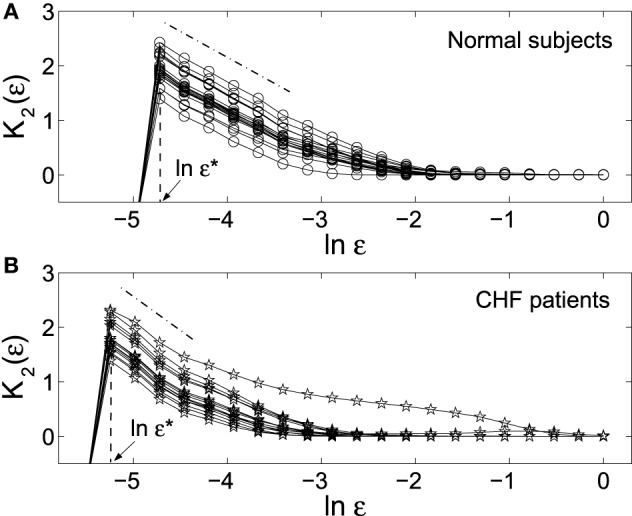
Figure 3.

K2 (ε) vs. ln ε curves for the HRV data of (A) 18 normal subjects and (B) 15 patients with CHF. Each curve corresponds to one subject. The computations were done with 3 × 10⁴ points and m = 5. ε* indicates the smallest scale resolvable by the data.
