Figure 4.

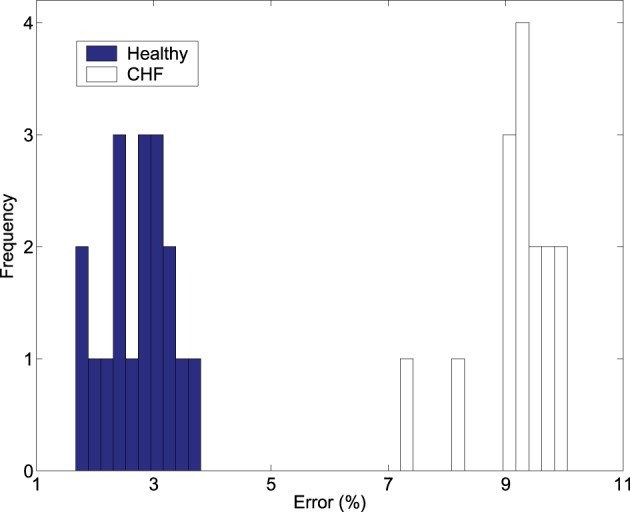
The frequency of the percentage of errors obtained by linearly fitting the K2 (ε) vs. ln ε curves in Figure 3 with 6 points starting from ε * for the healthy and diseased subjects.

The frequency of the percentage of errors obtained by linearly fitting the K2 (ε) vs. ln ε curves in Figure 3 with 6 points starting from ε * for the healthy and diseased subjects.