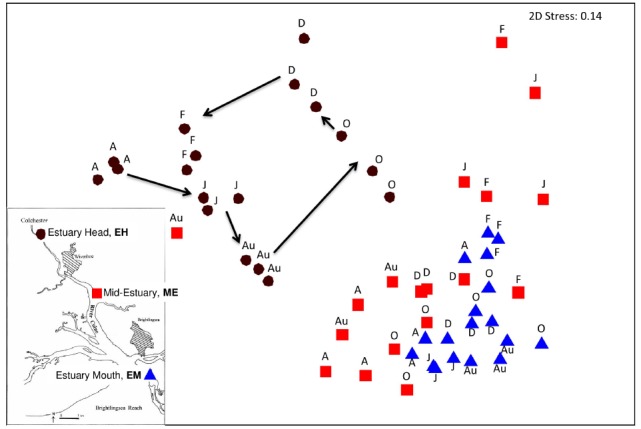
FIGURE 2.

Non-metric multi-dimensional scaling plot of total community T-RFLP profiles from three sites along the estuary sampled at 2-monthly intervals from April 2005 to February 2006. Each month is represented in biological triplicates and coded according to site. Insert map showing sample location along the Colne estuary. Black circles represent the estuary head (EH), red squares mid-estuary (ME) and blue triangles the estuary mouth (EM). A, April; J, June; Au, August; O, October; D, December; F, February 2006.
