
FIGURE 5.
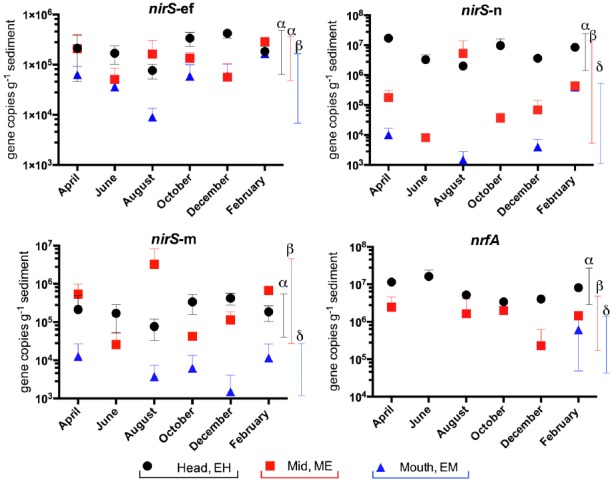
Variation in abundance (gene copies g–1 sediment ±SE, n = 3) of nitrite reductase genes (nirS and nrfA) in sediments along the Colne estuary sampled from April 2005 to February 2006. For each phylotype, significant differences in annual gene abundances between sites along the estuary are indicated by different Greek letters above colored lines [black, estuary head (EH); red, mid-estuary (ME); and blue, estuary mouth (EM)].