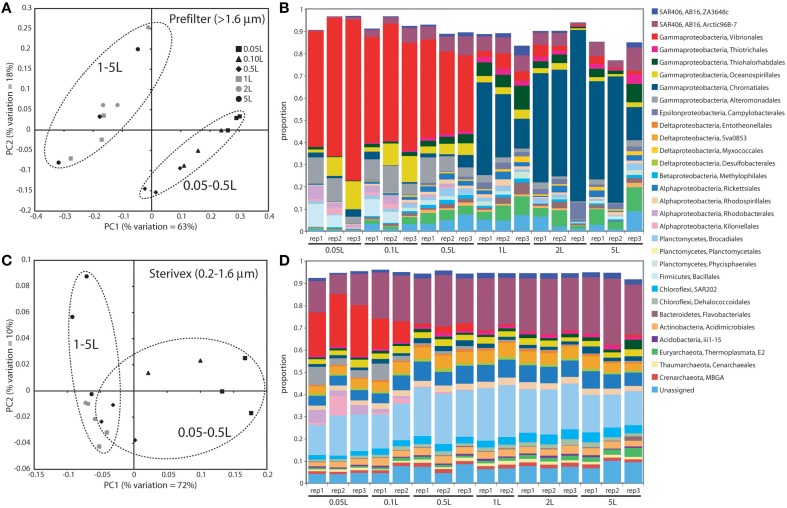
Figure 3.
Microbial community relatedness (A,C) and taxon abundances (B,D) in experiment 2 prefilter (>1.6 μm; A,B) and Sterivex (0.2–1.6 μm; C,D) samples. Relatedness based on 16S rRNA gene amplicon sequencing, as quantified by the weighted Unifrac metric. Samples representing different filtered water volumes are circled. Abundances in (B,D) are percentage abundances of major bacterial Orders. Only Orders with abundance >0.5% (averaged across all replicates) are shown.

