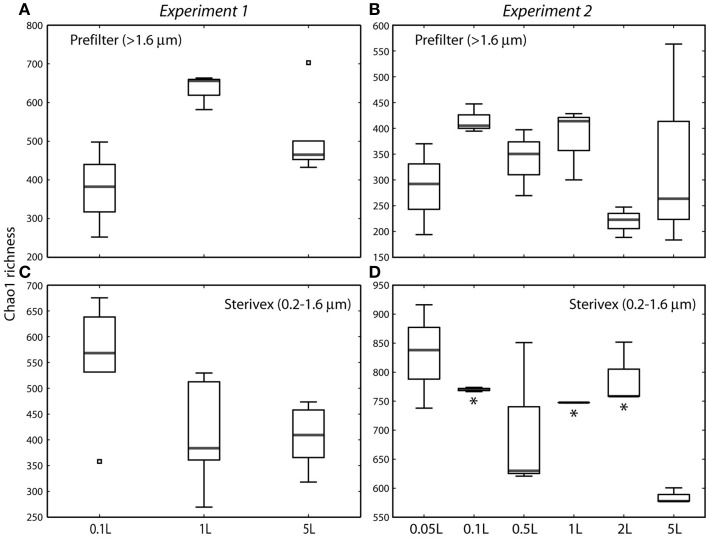
Figure 4.
Chao1 estimates of operational taxonomic unit (97% similarity cluster) richness in prefilter (>1.6 μm; A,B) and Sterivex (0.2–1.6 μm; C,D) samples in experiments 1 and 2. Boxplots show medians within first and third quartiles, with whiskers indicating the lowest and highest values within 1.5 times the interquartile range of the lower and upper quartiles, respectively. Note variation in y-axis scales. Asterisks in (D) indicate volume groupings with richness estimates significantly different from those of the 5 L sample (P < 0.05). All other pairwise differences between volume groupings were not statistically significant.

