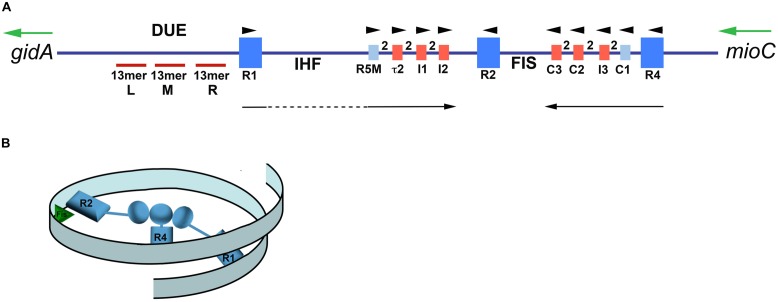
FIGURE 2.
Map of Escherichia coli oriC and conformation of bORC. (A) The oriC region is mapped, showing positions of binding sites for DnaA, IHF, and Fis, as well as the right (R), middle (M), and left (L) 13mer sequences in the DNA unwinding element (DUE). The three high-affinity sites R1, R2, and R4 are designated by royal blue squares, and the low-affinity sites are marked by small light blue or red rectangles. The red rectangles designate sites that preferentially bind DnaA–ATP, while the sites marked by light blue rectangles bind both nucleotide forms of DnaA equivalently. Small arrowheads show orientation of sites, the two between sites indicates the number of bp separating the sites. Arrows under the map indicate growth direction of DnaA oligomers. The dotted line marks that the oligomer does not span the region between R1 and R5M. Two genes, gidA and mioC, flanking oriC are shown, with the green arrows marking the direction of transcription. (B) Proposed looped conformation of bORC in E. coli. OriC DNA (ribbon) is constrained by DnaA (gray-blue figures in center of loop) bound at R1, R2, and R4 sites, as labeled. Interaction among the three bound DnaAs proposed to be via domain I. The green triangle represents Fis bound to its cognate site.

