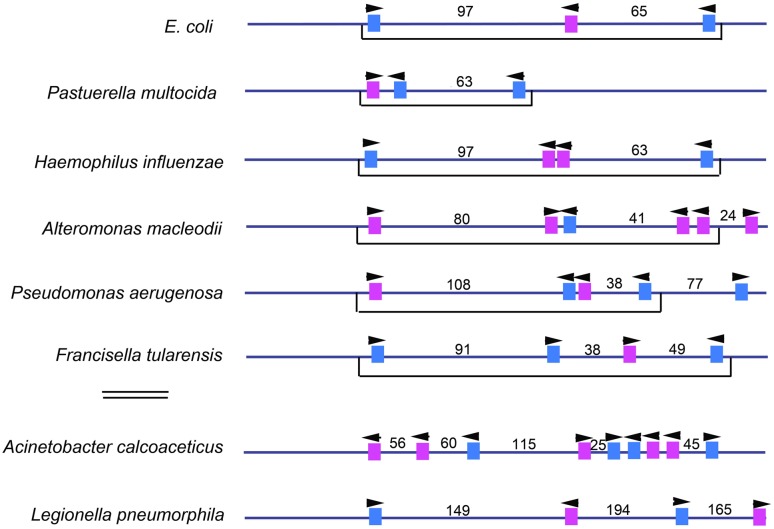
FIGURE 4.
Comparison of the number and placement of high affinity DnaA binding sites in oriCs in related members of the Gammaproteobacteria family. The high affinity sites in the oriC regions of E. coli and several related bacterial types are shown. Blue rectangles indicate sites that match the consensus 5′-TTATCCACA, and the pink rectangles mark sites which deviate from this sequence at one or two bases. The arrowheads mark the presumptive orientation of the sites, and the numbers designate the number of base pairs in the gap regions between sites. The brackets below the maps show an E. coli-like arrangement of high affinity sites (see text for details). The two bacterial types below the double line are larger than those above, but it should be noted that the maps are not drawn to scale.

