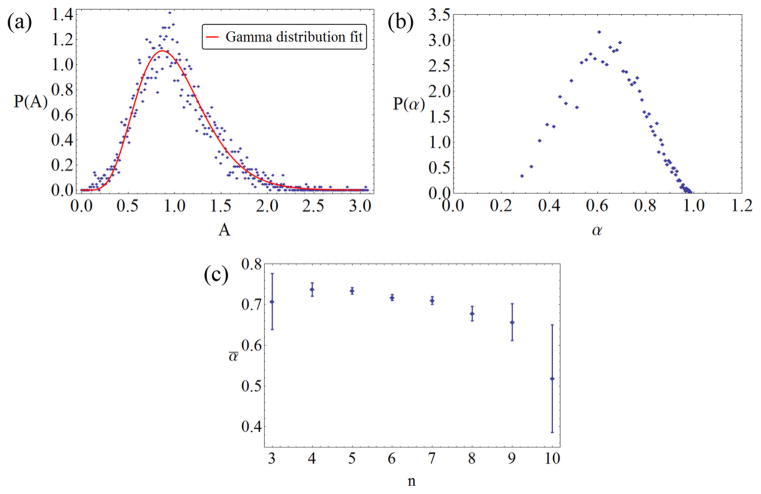
Figure 3.
(a) Binned experimental data of area probability distribution (symbols) and gamma distribution fit (solid line), with a coefficient of variation cA = 0.38. (b) Binned experimental data of probability distribution of cell aspect ratios. (c) Dependence of aspect ratio on number of neighbors; error bars are 95% confidence intervals.

