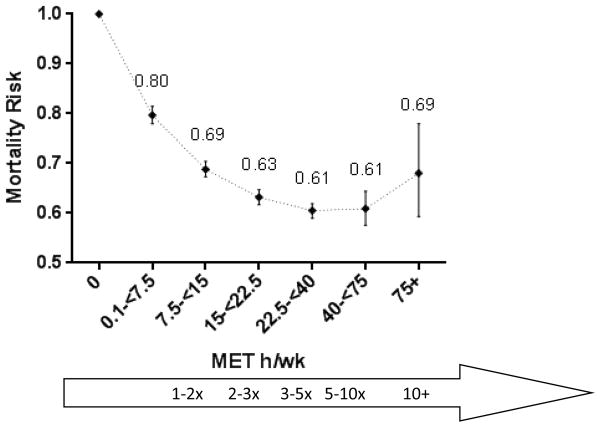
Figure 1. Hazard ratios (HRs) and 95% confidence intervals (CIs) for leisure time moderate- to vigorous-intensity physical activity and mortalitya-c.
The dose-response curve and category-specific hazard ratio estimates for leisure time moderate- to vigorous-intensity physical activity and mortality. Crude and adjusted risk estimates are presented in eTable3.
Exercise levels compared to the federally recommended minimum of 7.5 MET h/wk
aModels were stratified by cohort and use age as the underlying time scale. The model was adjusted for gender, smoking (never, former, current, missing), alcohol (none, <15 grams/day, 15–30 grams/day, 30+ grams/day), education (dropout, high school, post high school education, some college, college graduate, post-college, missing), marital status (married, divorced, widowed, single, missing), history of cancer, history of heart disease, and body mass index (<18.5, 18.5–25, 25-<30, 30-<35, 35+ kg/m2).
bThe dotted line between categories illustrates an assumed dose-response rather than individual data points.
cCrude and adjusted hazard ratios and 95% confidence intervals are presented in Supplemental Table 3.

