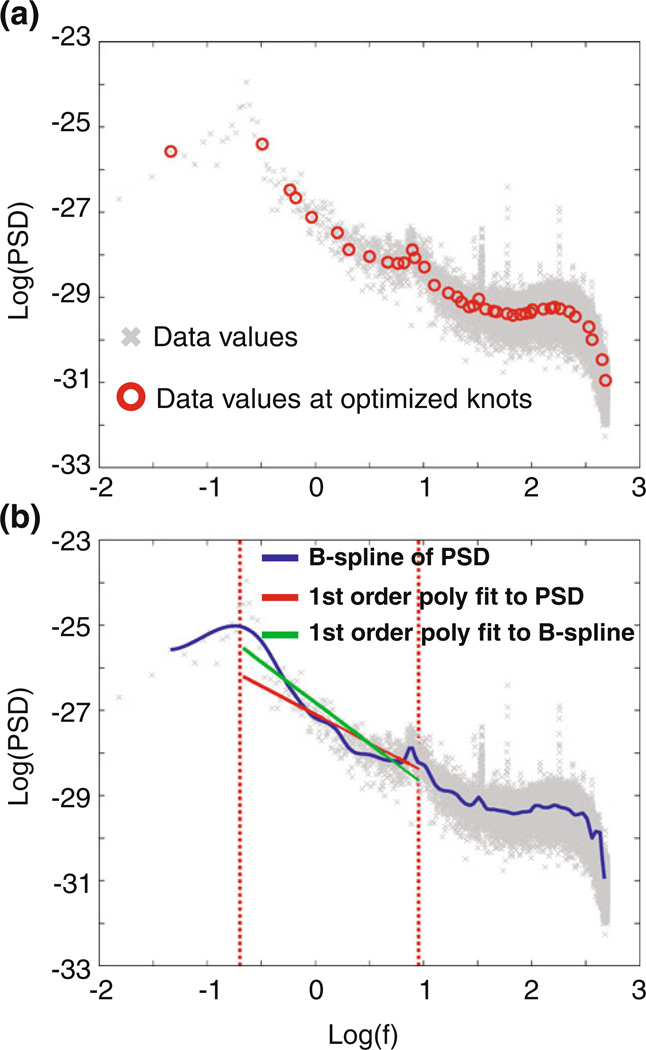
Fig. 2.
a log–log scale of the PSD vs frequency of a sample MEG sensor along with the corresponding log(PSD) values (shown as circles) at optimized knots in log-scale. b 1st degree Polynomial fit on B-spline curve effectively captures properties of the signal better than simple polynomial fit and avoids the 10 Hz peak. The fit was limited between 0.1 to 10 Hz excluding the boundaries. This limits the fit approximation to the next limiting optimized knots (between 0.1 and 0.2 to between 9 and 10 Hz) to avoid the peaks at alpha and low frequencies (shown by vertical dotted lines)

