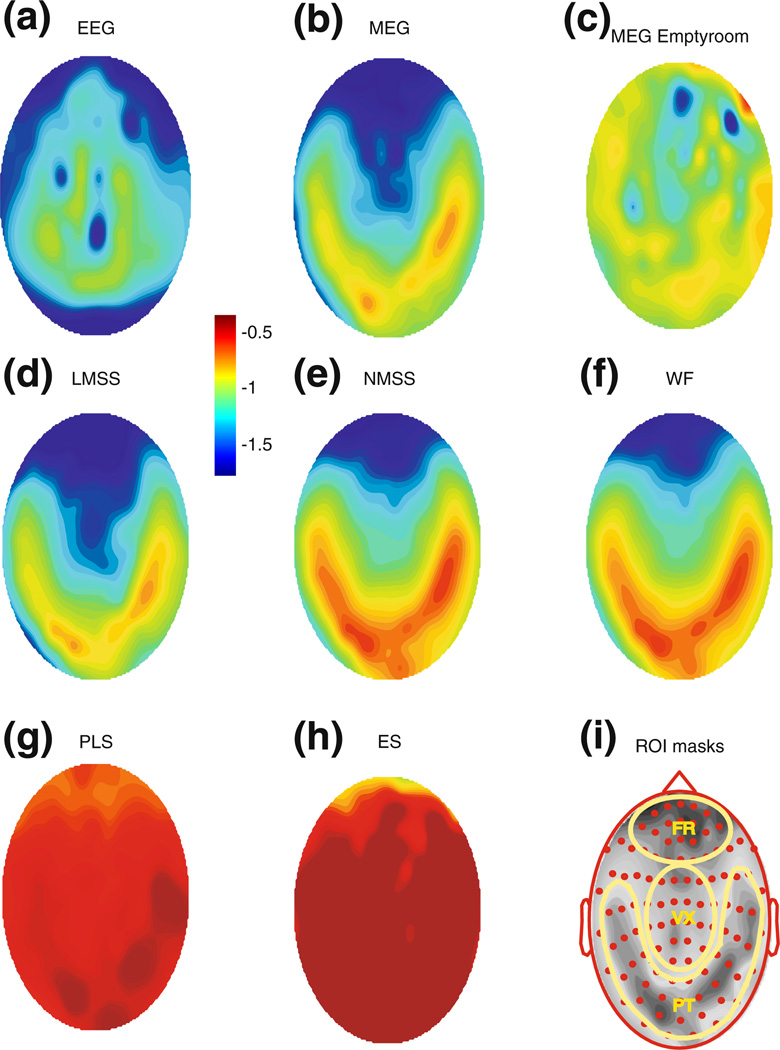
Fig. 4.
Topographical representation of frequency scaling exponent averaged across four subjects. (a) EEG awake. (b) MEG awake. (c) MEG empty-room. (d), (e) MEG after spectral subtraction of the empty-room noise using linear (LMSS) and non-linear (NMSS) methods respectively. (f) MEG spectral enhancement using Wiener filtering (WF). (g) MEG, partial least square (PLS) approximation of non-noisy spectrum. (h) Exponent subtraction (the exponent represented is the value of the frequency scaling exponent calculated for MEG signals, subtracted from the scaling exponent calculated from the corresponding emptyroom signals). (i) Spatial location of ROI masks (shown in yellow). FR covers the Frontal, VX covers Vertex and PT spans Parietotemporal. Dots show spatial arrangement of 102 MEG SQUID sensor triplets. The background gray-scale figure is same as the one in panel (b). Note that panels (a) through (h) use the same color scaling

