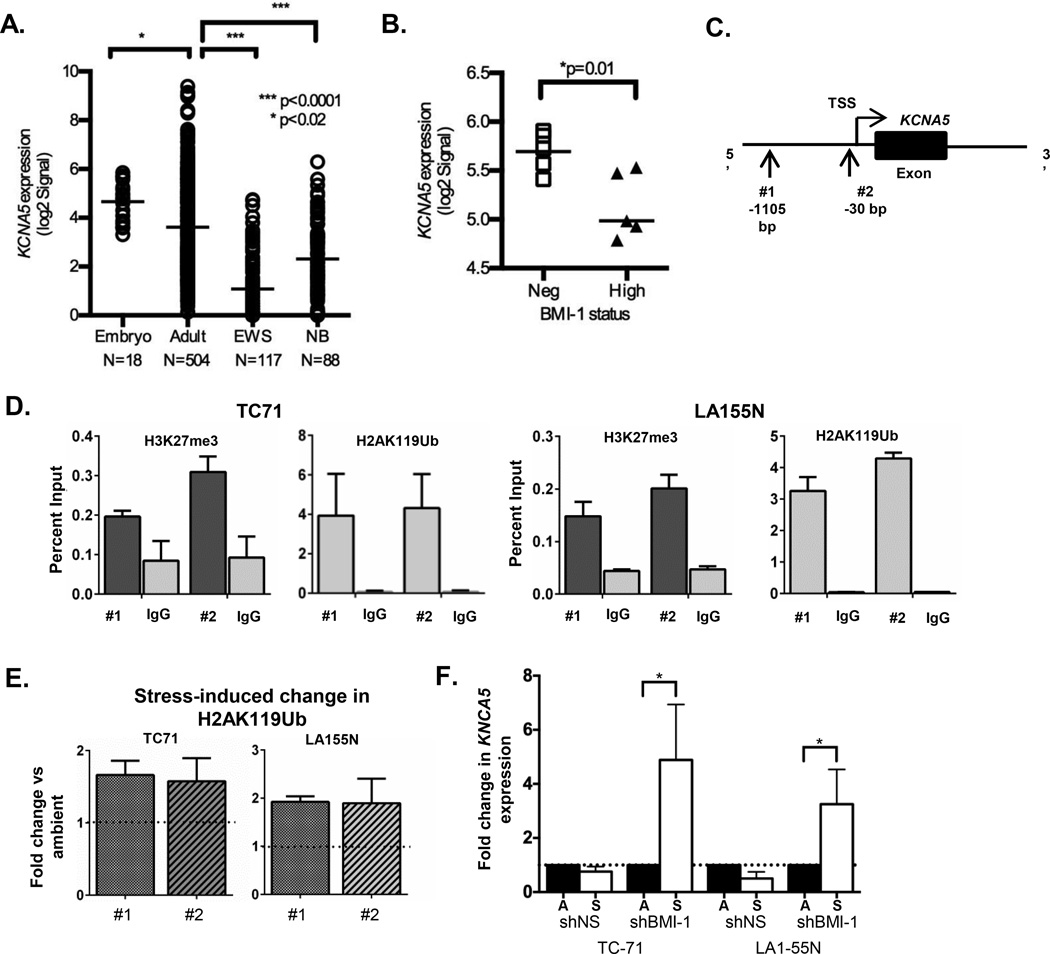
Figure 3. Polycomb group proteins repress KCNA5 in ES and NB cells.
(A) Publicly available microarray data were analyzed using the R2: microarray analysis and visualization platform (http://r2.amc.nl). Expression of KCNA5 is significantly lower in ES (GSE34620) and NB (GSE16476) tumors compared to normal embryonic (GSE15744) and adult (GSE7307) tissues. (B) Expression of KCNA5 is increased in ES tumors that do not express high levels of BMI-1 (GSE16016). * p<0.02 and *** p<0.001 (C) Site of PCR primers for evaluation of histone modifications at the KCNA5 promoter. (D) Chromatin immunoprecipitation-quantitative PCR (ChIP-qPCR) of ES and NB cells in ambient conditions shows enrichment of both H3K27me3 and H2AK119Ub marks at the KCNA5 promoter (relative to IgG control ChIP). (E) ChIP of ES and NB cells in ambient and stress conditions shows a near 2-fold increase in enrichment of H2AK119Ub at the KCNA5 promoter after exposure to stress. Data are from 2 independent experiments and are expressed as mean +/− SEM. (F) qRT-PCR analysis demonstrates significant upregulation of KCNA5 expression in BMI-1 knockdown ES and NB cells after 8 hours in stress conditions. Expression normalized to the geometric mean of HPRT and GAPDH in each sample and expressed as fold change in stress relative to ambient conditions. * p<0.05 by Mann-Whitney Test (mean ± SEM, n=3).

