
Figure 2. Network of host-influenza viral protein interactions.
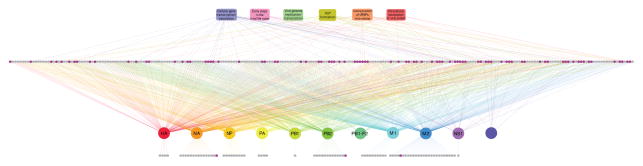
Interactions among the viral proteins and the 323 host factors identified here (gray and magenta circles) were visualized by using Cytoscape (http://cytoscape.org/). ‘Top hits’ (for a definition, see text and legend to Figure 1) are shown in magenta. Also shown are the steps in the viral life cycle affected by down-regulation of the respective host factor. The network image is fully-zoomable on the monitor. See also Tables S2 and S5.