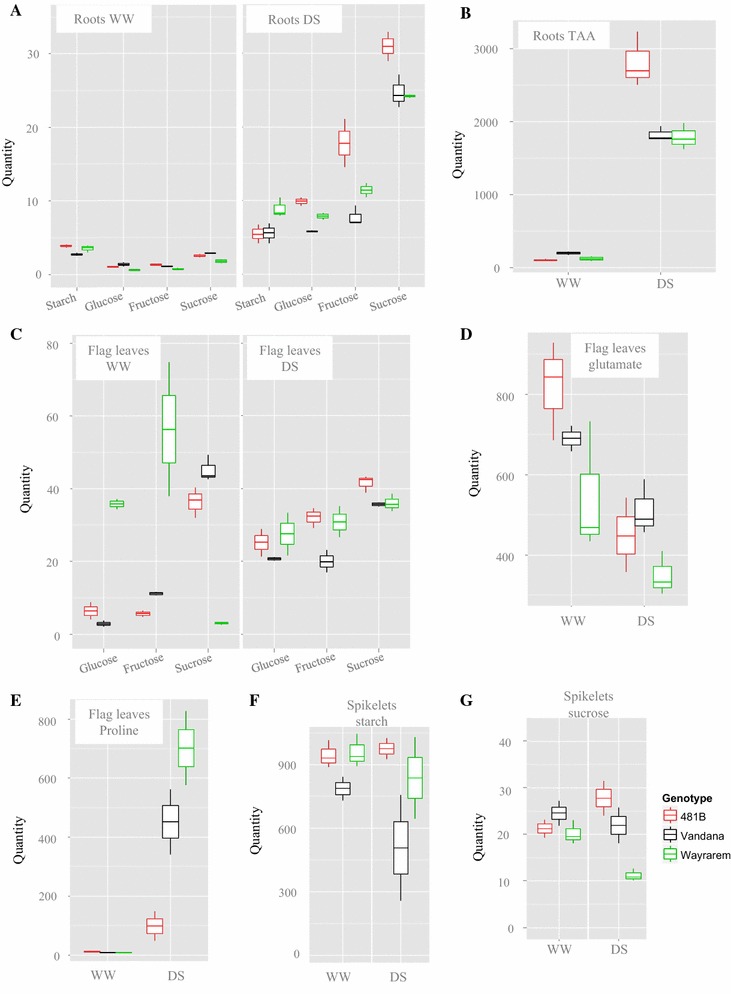
Fig. 2.

Boxplots of contents of specific metabolites in roots, flag leaves, and spikelets in well-watered and drought-stress conditions. a Boxplot of starch, glucose, fructose and sucrose in roots; b boxplot of total free amino acids in roots; c boxplot of glucose, fructose and sucrose in flag leaves; d boxplot of glutamate content in flag leaves; e boxplot of proline content in flag leaves; f boxplot of starch content in spikelets; g boxplot of sucrose content in spikelets. Components are represented in the horizontal axis and quantities in the vertical axis. Each vertical white line represents a metabolite or treatment as indicated, and the three boxes closest to it are the three genotypes: Vandana on the white line is coded in black, 481-B on the left of the line in red, and Way Rarem on the right of the line in green (as in the bottom right-hand side legend). In each box, the horizontal line represents the median of the data, the upper quartile represents the 75th percentiles, and the lower quartile represents the 25th percentile. The whiskers represented the 95 and 5 % of the data and the circles, when present, signified the outliers. Starch, glucose, fructose, and sucrose were measured in µmol/g fresh weight, while glutamate, proline, and total free amino acids were measured in pmol/mg
