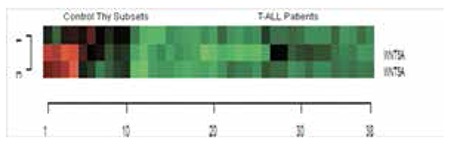
Figure 1. The heat map diagram of WNT5A probes in T-ALL patients and controls. Gene and samples were clustered using Euclidean distance and complete linkage method for the probe sets in 31 T-ALL patients and thymocyte subsets as controls [CD4 single positive, CD8 single positive, CD4+CD8+ double positive, Thymus (total thymus tissue), DP3- (CD4+, CD8+ double positive CD3 negative, immature single positive and CD3-, CD4-, CD8-)]. Three probe sets for WNT5A are illustrated in the heat map analysis. Green color shows downregulation and red color shows upregulation of the targeted gene.

