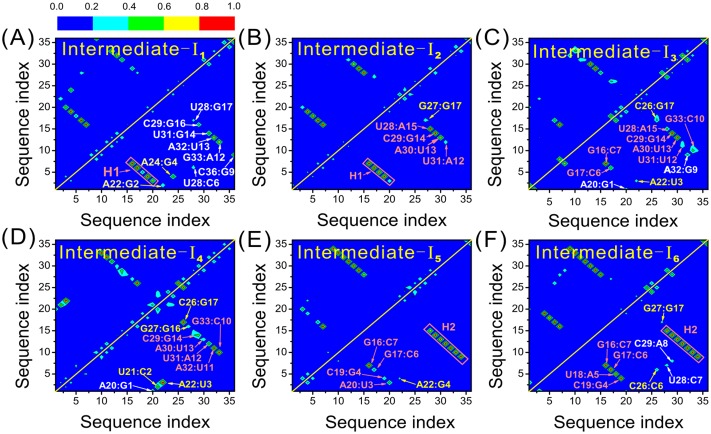
Fig 5. Average HB maps of the intermediates.
(A)-(F) are for the intermediates from I1 to I6. Different colors of the HBs indicate different formation probabilities as quantified by the color sale on the top of the figure. The labels of the hydrogen bonds are also colored, with the red, white and yellow colors indicating the native, non-native, and tertiary HBs, respectively.

