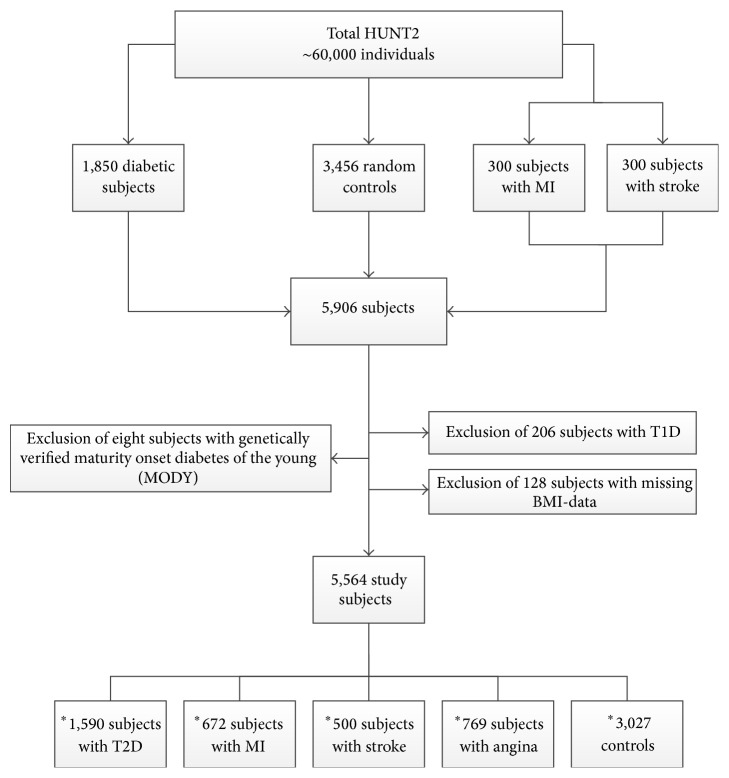
Figure 1.
Flow chart presenting the selection of study subjects. Flow chart presenting the inclusion and exclusion criteria of the study subjects enrolled in the present study. A total of 5,564 subjects were eligible for analysis. ∗Some individuals have more than one outcome (e.g., myocardial infarction (MI) and type 2 diabetes (T2D)); hence, the sum of these counts does not match the total counts of study subjects. T1D denotes type 1 diabetes. The final set of controls was reduced as subjects with MI and stroke were incorporated after the initial controls.

