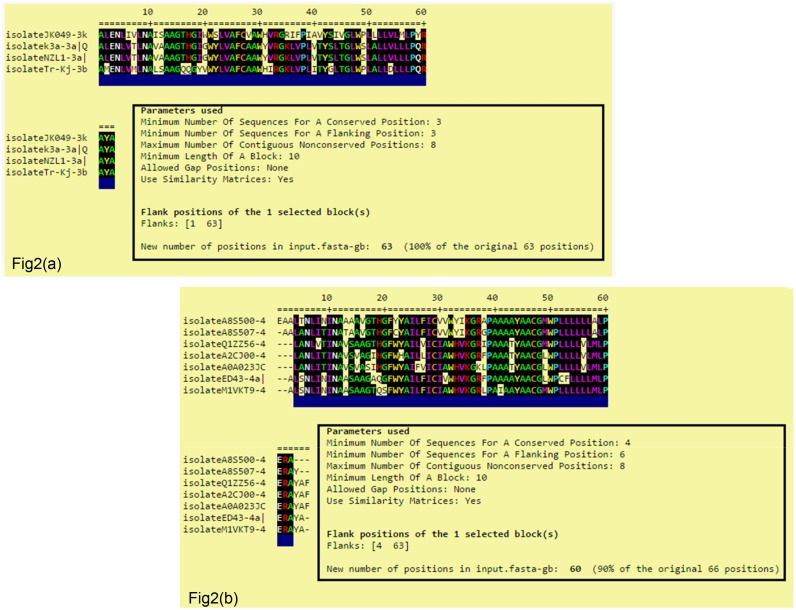
Fig 2. Multiple sequence alignment of HCV p7Comparative sequence alignment of HCV p7 with all GT3 subtypes using ClustalW program.
The conserved residues in all sequences have been highlighted by black color, as it denotes residues sharing ‘very similar’ and ‘less similar’ properties at that position, respectively. If there are no highlights, it denotes that there is no common residue in that position of the sequence. Isolatek3a and isolateNZL1 from GT3a showed maximum similarity compared to strains isolateJK049 and isolateTr-Kj. Sequence alignment was also performed within GT4 subtypes using ClustalW tool. The conserved regions sharing very similar sequence are highlighted in black. The GT4 subtypes showed much variation in the N-terminal region (1-13aa), followed by loop region (25-45aa) compared to C-terminal region (50-63aa).

