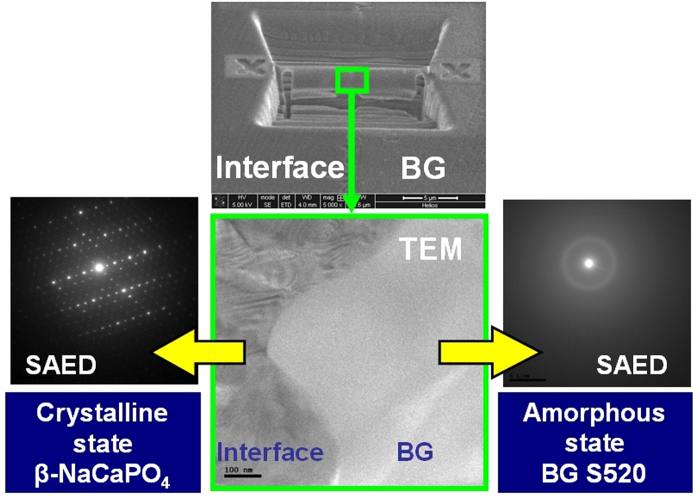
Figure 5.
TEM analysis of the interface between the CaP inner core and outer BG layer. (Upper center) SEM micrograph showing the area removed by FIB technique and the remaining lamella between the interface and the deposited glass. (Lower center) Transmission electron micrograph of the lamellae center showing the crystalline-amorphous border. (Lower left) The SAED of the interface revealing the characteristic diffraction pattern of β-rhenanite (β-NaCaPO4). (Lower right) The SAED of the very near BG to the interface confirms the amorphous state.

